Pi Network Price Prediction: Can PI Hold Its Breakout After KYC News?


The latest Pi Network price prediction is rising after a Pi Network Ventures portfolio company opened a survey on KYC and wallet problems.
The Pi coin is up 3.2% over the last 24 hours, and traders want to know whether the move has more room. PI now trades near $0.07807, a level that may decide the next few sessions.
Pi Network launched in 2019 as a mobile-first crypto project created by Stanford graduates, and its Open Network phase began in February 2025.
According to CoinGecko, Pi Network price today is $0.07807, within a 24-hour range of $0.07555 to $0.08144. $PI ranks 78th by market capitalization at about $883.115 million.
Live Pi Coin Market Data
Metric | Value |
Price | $0.07807 |
24h Change | +3.2% |
24h Range | $0.07555 to $0.08144 |
Market Cap | $883.115M |
Market Rank | #78 |
Source: CoinGecko, as of October 30, 2026.
Pi Network News Today
Pi Network news today centers on a user survey. According to BSCN Newswire, CiDi Games, a portfolio company of Pi Network Ventures, is collecting Pioneer feedback on KYC and Pi Mainnet wallet problems.
The responses will be passed to the Pi Core Team. The post gave no deadline and no number of expected responses, so traders can treat it as a sentiment factor, not a confirmed product change.
Source: Data Taken From @BSCNWire X Account, as of October 30, 2026.
Pi Network Technical Analysis
This Pi Network price prediction October 2026 reads the hourly PI/USDT chart on OKX.
Price spiked toward $0.0816 on the evening of October 29 and then formed a descending channel. It fell to about $0.0756 early on October 30.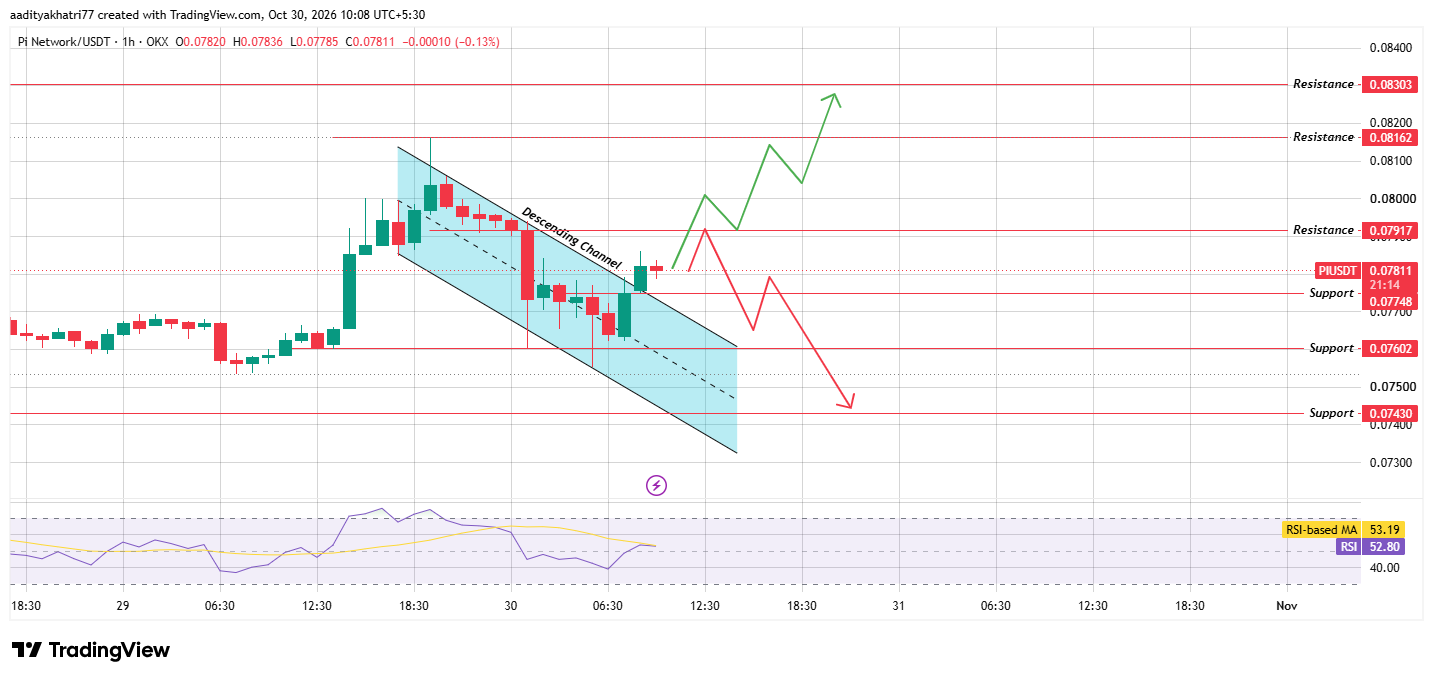
Source: TradingView, PI/USDT 1H, OKX, as of October 30, 2026.
A green hourly candle then closed above the upper boundary of the channel. That candle is the first sign of a breakout, though one hour close rarely settles the matter.
The latest candle opened at $0.07820, ranged from $0.07785 to $0.07836, and traded near $0.07811, a decline of 0.13%.
The RSI reads 52.80 against its average of 53.19, which shows balanced momentum.
Can $PI Hold the Breakout and Reach $0.07917?
The bullish case starts with follow-through. $PI needs an hourly candle to close green above the upper boundary of the channel, with volume above the 20-period average.
A second close above the boundary would add weight, since hourly breakouts often reverse.
The first resistance is $0.07917. A close above it on strong volume would open $0.08162 and then $0.08303.
The $0.08162 level sits near the October 29 spike high, so sellers may appear again in that area.
What Happens If $PI Is Rejected and Support Breaks?
The bearish case begins with a rejection at $0.07917. In that case, the price would likely return toward $0.07748, the first support, which sits close to the broken channel boundary.
An hourly close below $0.07748 on above-average volume would put the breakout in doubt. The next supports are $0.07602 and $0.07430.
If the price falls back inside the channel and closes there for several hours, the breakout may prove false.
Price Levels to Watch
Support | Resistance |
$0.07748 | $0.07917 |
$0.07602 | $0.08162 |
$0.07430 | $0.08303 |
Bull, Base, and Bear Scenarios for Pi Network Price Prediction
Scenario | Setup | Level |
Bull | A green hourly candle closes above the channel boundary and then above $0.07917 while volume runs over the 20-period average | $0.08162 first, then $0.08303 |
Base | PI stays between $0.07748 and $0.07917 with no hourly close beyond either level. | Between $0.07748 and $0.07917 |
Bear | Sellers defend $0.07917, and an hourly candle closes under $0.07748 with volume above the 20-period average. | $0.07602 first, then $0.07430 |
Pi Network vs Bitcoin
Any Pi Network price prediction 2026 should check how Pi coins trade against Bitcoin.
Over the last 24 hours, $PI is up 3.2% in dollars and up 5.3% against Bitcoin. Together, those figures imply that Bitcoin lost about 2% in dollar terms.
PI therefore moved against the market and beat Bitcoin. That strength helps the breakout case, yet it can fade quickly on an hourly chart.
Methodology
This Pi Network price prediction draws on three inputs. Market data comes from CoinGecko and was taken on October 30, 2026.
The chart is an hourly PI/USDT view from OKX in TradingView, with timestamps in UTC+5:30. The news item comes from a single BSCN Newswire post.
Support and resistance levels were read directly from the chart. The channel boundaries carry no labels, so the breakout point is described in words and not as a fixed price. Hourly levels apply to the next day or two, not to weeks.
CoinGecko combines prices from many exchanges, so its 24-hour range differs slightly from the OKX candles.
Trading volume, supply figures, and liquidation data were not part of this review, and the scenarios carry no assigned probabilities.
Expert Opinion
The report from BSCN Newswire shows a Pi Network Ventures portfolio company gathering user feedback. As general market commentary, a survey is a listening step and not a product change.
The post links the survey to KYC and wallet problems, which affect how smoothly users can move $PI. In the short term, the $0.07748 level will show whether buyers give the news weight.
Disclaimer: This article is for information only and is not financial advice. PI is volatile, and price can fall below $0.07430 if support fails and broader market conditions weaken. breakouts reverse often. No scenario here carries a stated probability, and a confirmed breakout can still fail. Readers should do their own research and size any position to a loss they can accept.