Bitcoin Cash Price Prediction September 2026: Can BCH Hit $1000?


Bitcoin Cash has arrived at a spot on the weekly chart that traders wait months for.
The Bitcoin Cash price prediction September 2026 setup right now revolves around a single sloping line that has rejected every attempt to climb through it, and price is knocking on that door again.
This is not the first time the level has been tested either, which makes what happens next carry extra weight.
Momentum on the weekly oscillator has already started curling in a way that hints something is shifting beneath the surface.
Whether this turns into the breakout bulls have been waiting for or another rejection that sends BCH lower depends on how the next few weekly candles close. Here is the full picture.
Bitcoin Cash Price Today: Live Data and 24-Hour Change
BCH is changing hands near $266.1 at the time of writing, sitting directly against the descending trendline that has capped every rally since the token topped out earlier in the cycle.
The broader market snapshot shows Bitcoin Cash trading around $266.4, down close to 0.59 percent on the day, with a market capitalization of roughly $5.35 billion.
Futures volume over the past 24 hours came in near $204.34 million against spot volume of about $20.41 million, showing that derivatives desks are far more active in this move than spot buyers right now.
Open interest stands at approximately $438.80 million, and circulating supply sits at 20.08 million BCH out of a capped max supply of 21 million.
(Source: CoinGlass and TradingView, August 27, 2026)
Bitcoin Cash Futures Activity and Liquidation Pressure
Liquidation data over the past day shows a market that has been punishing both sides of the trade.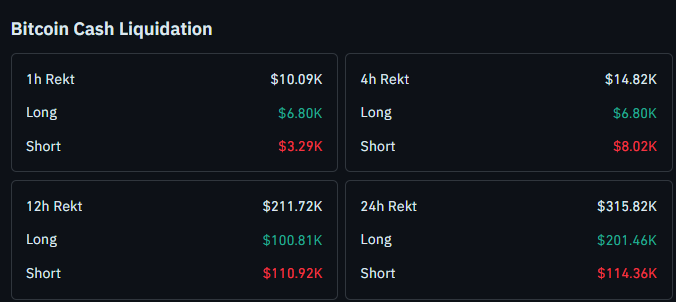
In the last 24 hours, long positions worth $201.46K were wiped out compared with $114.36K in short liquidations, suggesting leveraged buyers have been getting shaken out even as price grinds higher into resistance.
Zoom into the 12-hour window and the pattern flips, with $100.81K in longs liquidated against $110.92K in shorts, a much tighter contest that points to two-way positioning right at the trendline.
The most recent 1-hour and 4-hour windows show liquidations cooling off sharply, with combined totals under $15K, which typically happens right before a decisive breakout or breakdown candle prints.
This kind of squeeze on both sides at a major trendline is often the market clearing out weak hands before the real move begins. (Source: CoinGlass, August 27, 2026)
Quick Take
CMP: $266.1
Weekly trigger level: close above the descending trendline resistance, currently tracking near the $270 to $280 zone
Weekly failure level: close below $182.0
Data timestamp: August 27, 2026
Risk note: leverage on both sides has been getting flushed near this trendline, which can precede sharp directional moves in either direction
Bitcoin Cash Technical Forecast August 2026
The weekly chart tells a clean story once you strip away the noise.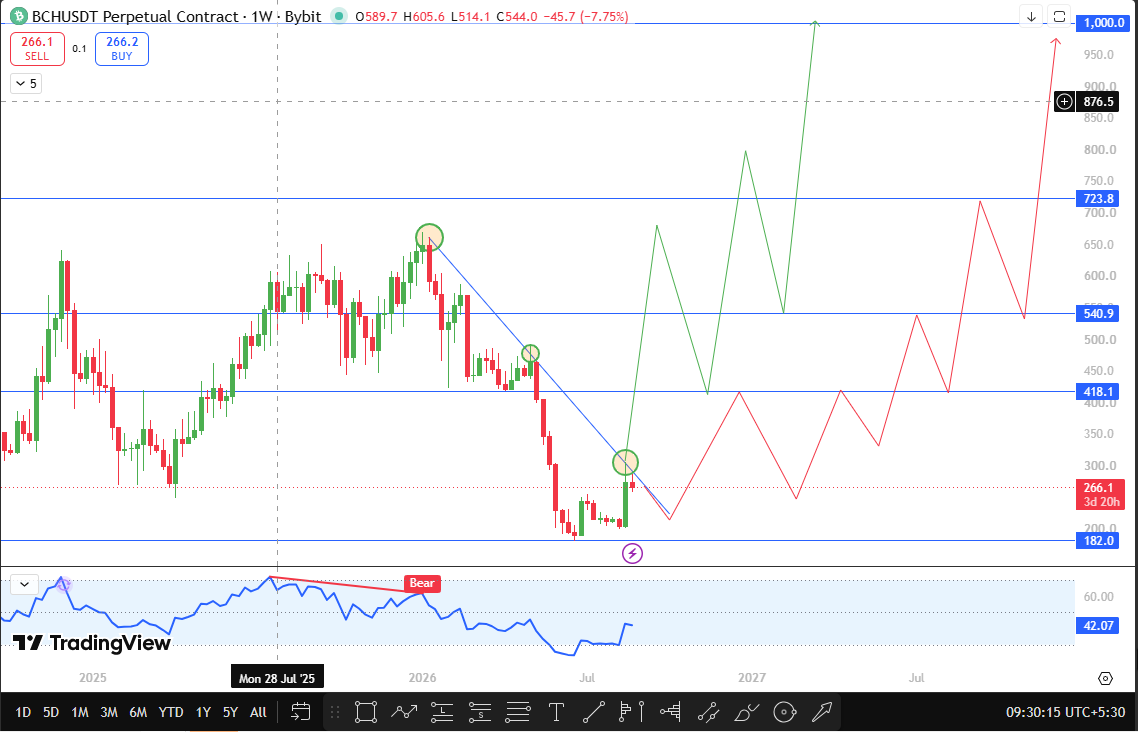
BCH topped out in the 605 to 650 region and then carved a steady descending trendline lower, tagging that same line twice already without managing a clean weekly close above it.
Both prior touches ended in fresh selling, dragging the price down toward the 182 to 220 zone where a base has started to form.
Now the price has pushed back up into the trendline for a second retest, and this time the setup looks a little different.
The weekly momentum oscillator, which had been carrying a bearish tag on the last major swing down, has started to round higher, and price is compressing tightly into the trendline rather than getting rejected outright.
If Bitcoin Cash manages a weekly close above this descending trendline, that would confirm both a breakout and a bullish continuation structure.
The immediate target on that scenario sits at 418.1, which lines up with a prior demand and supply flip zone from earlier in 2025.
Clearing that opens the door toward 540.9, then 723.8, with the major upside extension sitting at the psychological 1,000 level.
On the other hand, if BCH fails here for a third time and slips back down, a weekly close below 182.0 would invalidate this bullish structure entirely and put the recent low under threat.
(Source: TradingView, BCHUSDT 1W chart, Bybit, August 27, 2026)
BCH Support and Resistance Levels
Level Type | Price | Change from CMP |
Resistance 1 (Trendline breakout zone) | ~$270-$280 | +1.5% to +5.2% |
Resistance 2 | $418.1 | +57.1% |
Resistance 3 | $540.9 | +103.3% |
Resistance 4 | $723.8 | +172.0% |
Resistance 5 (major target) | $1,000.0 | +275.8% |
Support 1 (Invalidation) | $182.0 | -31.6% |
Bull, Base, and Bear Case for Bitcoin Cash
In the bull case, BCH clears the descending trendline with a strong weekly close and holds above it on the retest, opening a clean path toward 418.1 first and then the higher targets at 540.9 and 723.8 as continuation unfolds.
The base case has price chopping around the trendline for another week or two, unable to fully commit either way while liquidation data on both longs and shorts stay elevated, keeping BCH range-bound between roughly 220 and 300.
The bear case plays out if sellers defend the trendline a third time and push BCH back down through support, with a weekly close below 182.0 confirming the bearish structure is back in control and opening room toward the prior lows.
On-Chain and Fundamental Drivers
Open interest near $438.80 million against a market cap of $5.35 billion shows leverage is meaningfully sized relative to the asset, which explains why liquidation swings have been so sharp around this trendline test.
The gap between futures volume at $204.34 million and spot volume at $20.41 million over the past 24 hours also stands out, confirming that this move is being driven largely by derivatives traders positioning around the technical level rather than organic spot accumulation.
With circulating supply already at 20.08 million against a hard cap of 21 million, BCH has limited new supply pressure ahead, which can amplify moves once a breakout direction is confirmed.
August 2026 Catalysts
The most immediate catalyst for Bitcoin Cash is the trendline test itself, since a confirmed weekly close either side of it will likely dictate positioning into September.
Broader market liquidity conditions and Bitcoin's own price action will also weigh heavily here, since BCH has historically tracked large-cap momentum closely during breakout attempts.
Continued deleveraging in the futures market, as shown by the sharp drop in short-term liquidations, could set the stage for a lower-volatility grind before the next decisive move.
Risks to This Bitcoin Cash Outlook
The biggest risk to the bullish thesis is a repeat of the last two trendline rejections, where BCH pushed into resistance only to reverse hard.
Elevated open interest also means any sharp move can trigger cascading liquidations that overshoot fair value in either direction.
Traders should watch for wicks above the trendline without a confirmed weekly close, since these can trap late buyers before a reversal.
How to Buy and Store Bitcoin Cash
Bitcoin Cash can be purchased on major exchanges through spot or futures markets, with Bybit and Binance among the platforms offering active BCH pairs.
For long-term holding, moving BCH off exchanges into a hardware wallet remains the standard security practice, while active traders may keep smaller amounts on exchange for liquidity around key technical levels like the ones outlined above.
Glossary
Descending trendline: A line connecting a series of lower highs, acting as dynamic resistance until price closes above it.
Weekly close: The final settled price of an asset at the end of a weekly candle, used to confirm breakout or breakdown signals.
Liquidation: The forced closure of a leveraged position when losses exceed available margin.
Open interest: The total number of outstanding derivative contracts that have not been settled or closed.
Invalidation level: A specific price point where, if breached, a technical thesis is considered no longer valid.
Disclaimer
This article is for informational purposes only and does not constitute financial advice. Cryptocurrency markets are highly volatile, and readers should conduct their own research before making any investment decisions.
Also read:

















