Bitcoin Cash Price Prediction: Is $BCH Finally Turning Bullish Again?


Bitcoin Cash has spent most of this year under heavy pressure, and traders are starting to ask if that story is finally changing.
This Bitcoin Cash price prediction looks at whether $BCH is quietly building a base for its next real move or whether this bounce is just another pause inside a longer downtrend.
Something has shifted across both the daily and the 4-hour charts this week. The bigger question is whether it actually holds.
Is Bitcoin Cash Turning Bullish Again Right Now?
Direct answer: $BCH trades near $218.59, up 3.73% in 24 hours, as price pushes back above short-term EMA support on the 4-hour chart.
Daily RSI sits at 46.69 and is curling higher after a deep oversold dip, while the Bollinger Bands have narrowed into a tight squeeze that often comes before a sharper directional move.
None of this confirms a full trend reversal yet. It does mark the first real technical improvement BCH has shown in weeks.
Bitcoin Cash Price Prediction: Key Takeaways
-
$BCH is up 3.73% in 24 hours, trading near $218.59 with 24-hour volume up 81.1% to $111.41M.
-
Daily RSI at 46.69 is recovering from deep oversold levels, while Bollinger Bands have compressed into a tight squeeze.
-
The 4-hour chart shows price reclaiming its EMA after a bearish crossover on July 15 sent BCH sliding to $208.50.
-
BCH just broke out of a $209 to $212 consolidation range that held for several sessions.
-
CoinGlass liquidation data shows a mixed picture; longs took the bigger hit on shorter timeframes while shorts got squeezed harder over the full 24 hours.
What Are The Latest Bitcoin Cash Market Numbers?
Bitcoin Cash (BCH) trades at $218.59 with a $4.38 billion market cap, up 3.73% in the past 24 hours, according to CoinMarketCap data as of July 27, 2026, 17:28 IST.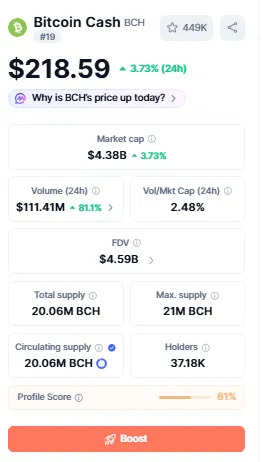
Daily trading volume has jumped 81.1% to $111.41 million, pushing the volume to market cap ratio to 2.48%, a sign that today's move is backed by real participation rather than thin trading.
Why Is Bitcoin Cash Price Moving Today?
The jump in 24-hour volume is the clearest clue here. A move this size on volume nearly double the usual pace tends to reflect genuine buying rather than a random wick.
That volume pickup lines up almost exactly with price clearing its short-term EMA on the 4-hour chart, which is generally read as a sign that new demand is stepping in rather than existing holders simply rotating positions.
What Happened After The July 15 EMA Bearish Crossover?
The 4-hour BCH/USDT chart on Binance via TradingView shows a 20 and 50 EMA bearish crossover forming on July 15. 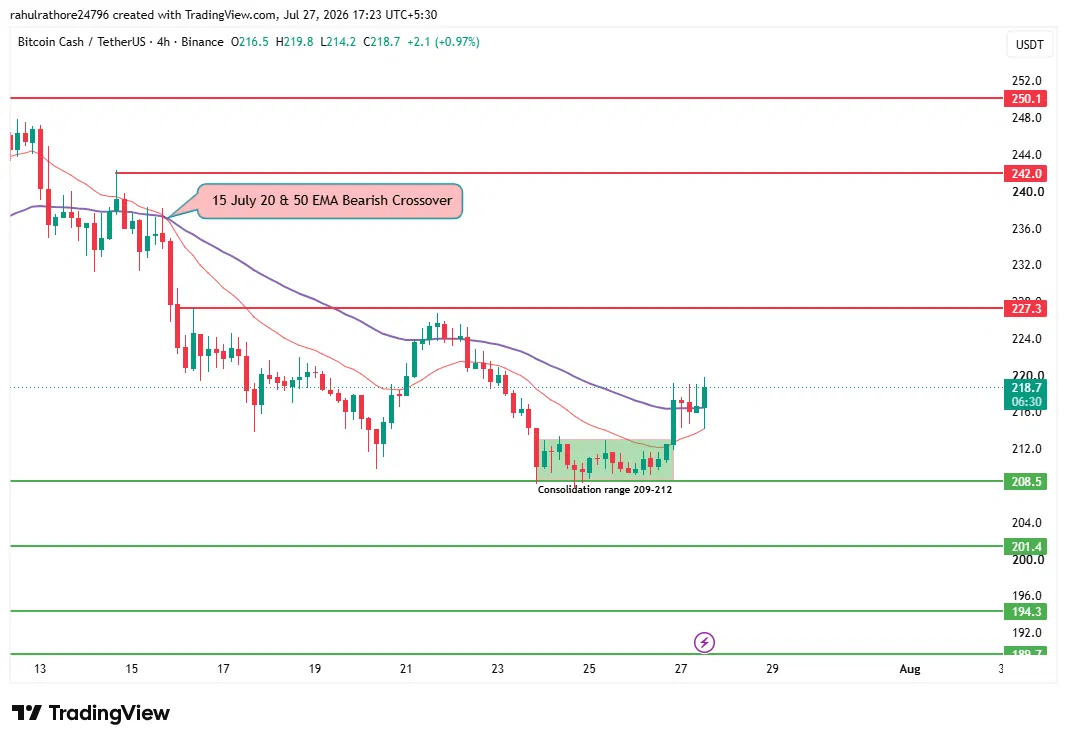
That crossover marked the start of a sharp slide, taking the price all the way down to the $208.5 zone within a few sessions.
From there, BCH settled into a tight $209 to $212 consolidation range, grinding sideways for several days while the moving averages flattened out above price.
Is BCH Breaking Out Of Its Consolidation Range?
Price has just pushed up out of that $209 to $212 box and reclaimed the EMA line that capped it during the bearish phase. On the 4-hour chart, resistance sits at $227.3, then $242.0, and $250.1 further out.
If BCH holds above the reclaimed EMA, the setup favours a short-term bullish crossover forming next.
A failure here would likely send the price back toward $208.5 and possibly $201.4 or $194.3 below that.
What Does The Daily Bollinger Band Structure Show?
On the daily BCH/USDT chart on Binance via TradingView, the Bollinger Bands tell most of the story here. 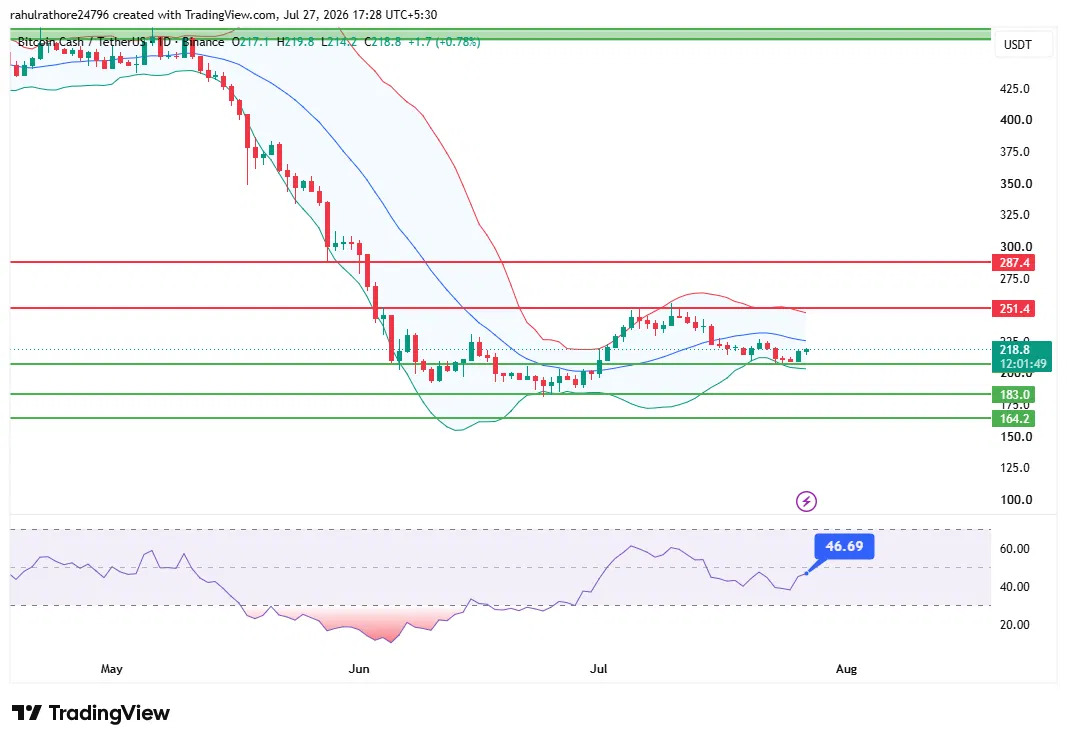
The price fell hard from above $400 in May, sliding straight through the lower band during that decline, a classic sign of a strong trending move rather than normal volatility.
By June, price found a floor and began chopping sideways, and the bands themselves started to narrow.
That kind of Bollinger Band squeeze usually signals that volatility has dried up and the market is coiling before its next big swing in either direction.
BCH is currently trading back near the middle of the band structure, with resistance levels visible at $251.4 and $287.4 above and support sitting at $183.0 and $164.2 below.
What Is The Daily RSI Signalling Right Now?
Daily RSI reads 46.69, sitting just under the neutral 50 mark. Back in June, RSI dropped deep into oversold territory below 30, and it has been climbing steadily since, which lines up with the bounce off the lows on the price chart itself.
An RSI below 50 still leans slightly cautious. The upward hook is worth watching, since a clean push through 50 would add more weight to the bullish case.
What Does BCH Liquidation Data Reveal About Trader Positioning?
According to CoinGlass liquidation data , the picture across timeframes is mixed rather than one-sided. Over the past hour, $139.14 in total positions were liquidated, with longs accounting for $118.71 of that against just $20.43 in shorts.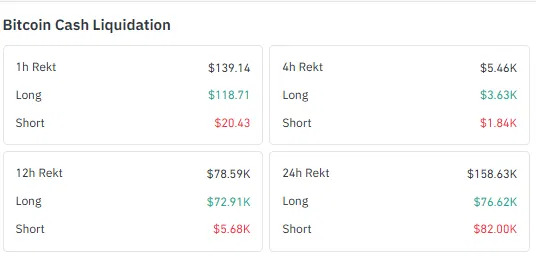
The 4-hour and 12-hour windows show a similar tilt toward long liquidations, at $5.46K and $78.59K, respectively, with shorts making up a much smaller share in both cases.
The full 24-hour window flips slightly. Total liquidations reach $158.63K, and this time shorts take marginally more of the hit at $82.00K against $76.62K in longs, suggesting some short covering helped fuel today's bounce even as longs got hurt earlier in the slide.
Note: The following table presents the latest Bitcoin Cash (BCH) liquidation data as of July 27, 2026, 17:28 IST, sourced from Coinglass.
Bitcoin Cash Price Prediction: Bull, Base, And Bear Case
Methodology note: These targets come from the daily and 4-hour BCH/USDT chart structure, prior swing levels, and the current EMA and Bollinger Band positioning.
Invalidation levels mark where each scenario's core assumption breaks down. These are technical projections, not guaranteed outcomes.
Bitcoin Cash (BCH) Tokenomics Overview
The table below presents the latest Bitcoin Cash (BCH) tokenomics data as of July 27, 2026, 17:28 IST, sourced from CoinMarketCap
Expert Opinion: What Does This Bitcoin Cash Price Prediction Suggest?
CoinGabbar market analyst notes that the combination of a Bollinger Band squeeze on the daily chart and an EMA reclaim on the 4-hour chart is a setup worth watching closely, though not yet a confirmed reversal.
The mixed liquidation picture supports a cautious read rather than a purely bullish one.
Longs absorbed the bigger hit during the slide toward $208.5, while shorts have started taking losses too as the price recovered, which often happens in the early stage of a genuine base rather than a one-sided move.
A daily close above the mid-band zone with RSI clearing 50 would strengthen the bullish case meaningfully. Losing the $208.5 support would put the EMA bearish crossover back in control.
Quick Glossary for Bitcoin Cash Price Terms
Bollinger Bands: A volatility indicator made of a moving average with upper and lower bands that widen or narrow based on how much price is swinging.
EMA Crossover: When a shorter exponential moving average crosses above or below a longer one, it is often used to confirm a shift in trend direction.
RSI (Relative Strength Index): A momentum indicator from 0 to 100 that flags overbought conditions near 70 and above, and oversold conditions near 30 and below.
Consolidation Range: A period where price trades sideways between a defined support and resistance zone before breaking in either direction.
Liquidation: The forced closing of a leveraged position when the market moves against a trader beyond what their margin can cover.
YMYL Disclaimer: This article is for informational purposes only and should not be considered financial, investment, or trading advice. Cryptocurrency markets, including Bitcoin Cash, are highly volatile and speculative. This Bitcoin Cash price prediction is based on technical chart analysis and public data as of July 27, 2026, and may not reflect future performance. Readers should conduct their own research and consult a licensed financial advisor before making any investment decisions.
Also read: