Bitcoin Cash Price Prediction: Why $BCH Is Up 17%, Long-Term Key Level


Bitcoin Cash is having a big day. BCH just increased by double digits, and traders are already sharing charts calling for a much bigger move ahead.
This Bitcoin Cash Price Prediction breaks down what's fueling the rally, what the liquidation data reveals, and the levels that matter most right now.
Here's the full picture.
Market data was checked on August 22, 2026, at 11:32 IST.
BCH Live Price and Market Stats
Metric | Value |
Price | $281.04 |
24h Change | +17% |
Market Cap | $5.62B |
FDV | $5.88B |
24h Volume | $975M+ |
Vol/Mkt Cap (24h) | 17.33% |
Total Supply | 20.07M BCH |
Max Supply | 21M BCH |
Circulating Supply | 20.07M BCH |
Holders | 37.81K |
Source: Data from CoinMarketCap as of August 22, 2026, at 11:45 IST. Figures may vary slightly across other tracking websites.
Bitcoin Cash Liquidation and Volume Data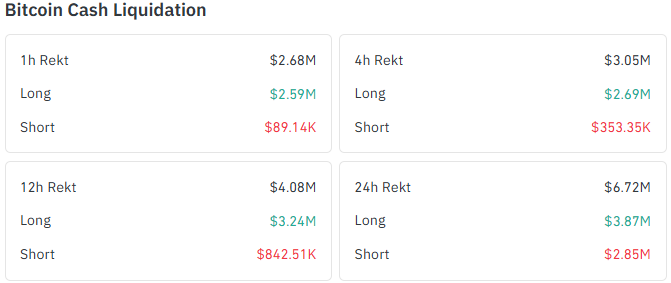
Coinglass futures data shows heavy long liquidations as leveraged shorts got caught off guard by today's spike.
Timeframe | Total Liquidated | Long Liquidations | Short Liquidations |
1h | $2.68M | $2.59M | $89.14K |
4h | $3.05M | $2.69M | $353.35K |
12h | $4.08M | $3.24M | $842.51K |
24h | $6.72M | $3.87M | $2.85M |
Longs dominated liquidations across every window, meaning leveraged long positions got flushed out hard during the pullback from the day's high, not shorts.
That's a bit unusual for a breakout day and suggests some of today's move was leveraged longs piling in near the top before the retracement hit.
BCH Price Prediction Chart: Technical Analysis
Pair: BCH/USD · Market: Spot (Crypto) · Timeframe: 1D · Source: TradingView · Timestamp: August 22, 2026, 11:32 UTC+5:30
BCH broke out sharply today, spiking from the $250.12 to $264.60 range up to a high of $305.17 before pulling back to the $281.04 level.
If the price holds above the current support level and builds liquidity around this zone, it could strengthen the setup and support a continued move toward the upside.
RSI sits at 78.63, deep into overbought territory.
The EMA cluster sits well below the current price, acting as a longer-range floor rather than near-term resistance.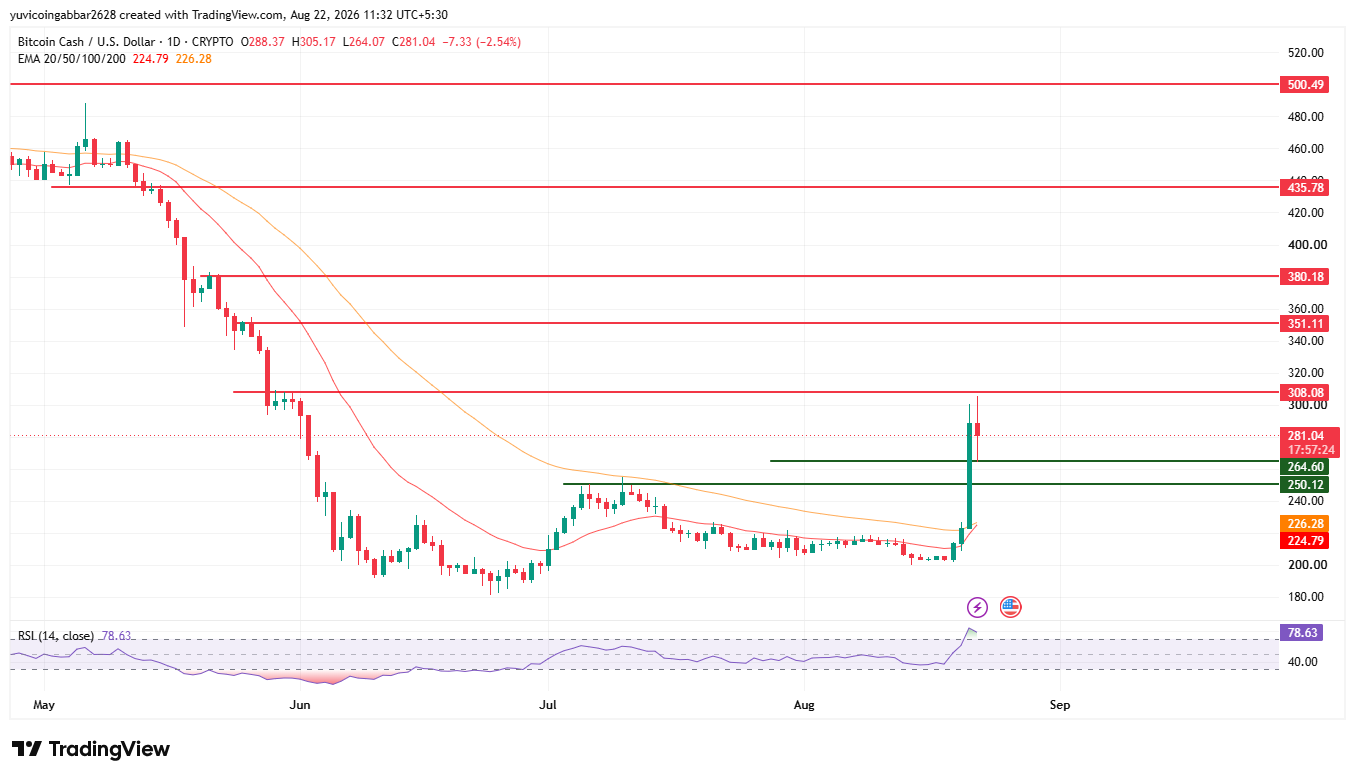
BCH breakout rally: Key Levels
Level Type | Price |
Resistance 4 | $500.49 |
Resistance 3 | $435.78 |
Resistance 2 | $380.18 |
Resistance 1 (nearest) | $351.11 |
Next Resistance | $308.08 |
Immediate Price Reference | $281.04 |
First Support | $264.60 |
Deeper Support | $250.12 |
BCH price prediction: Long-Term Price Levels
Year | Price Level | Note |
2026 | $308.08 – $350 | Based on the nearest chart resistance levels if the current breakout holds |
2027 | $351 – $435 | Speculative; needs sustained momentum beyond current chart levels |
2028 | $435 – $500 (est.) | Purely speculative; depends on market cycles and adoption |
$BCH "Eyes On It": What Traders Are Saying
A long-term weekly chart of BCH, captioned simply "$bch eyes on it," showing a multi-year base building below a marked resistance zone and drawing a projected breakout path higher.
No specific price target or timeframe was stated in the post. 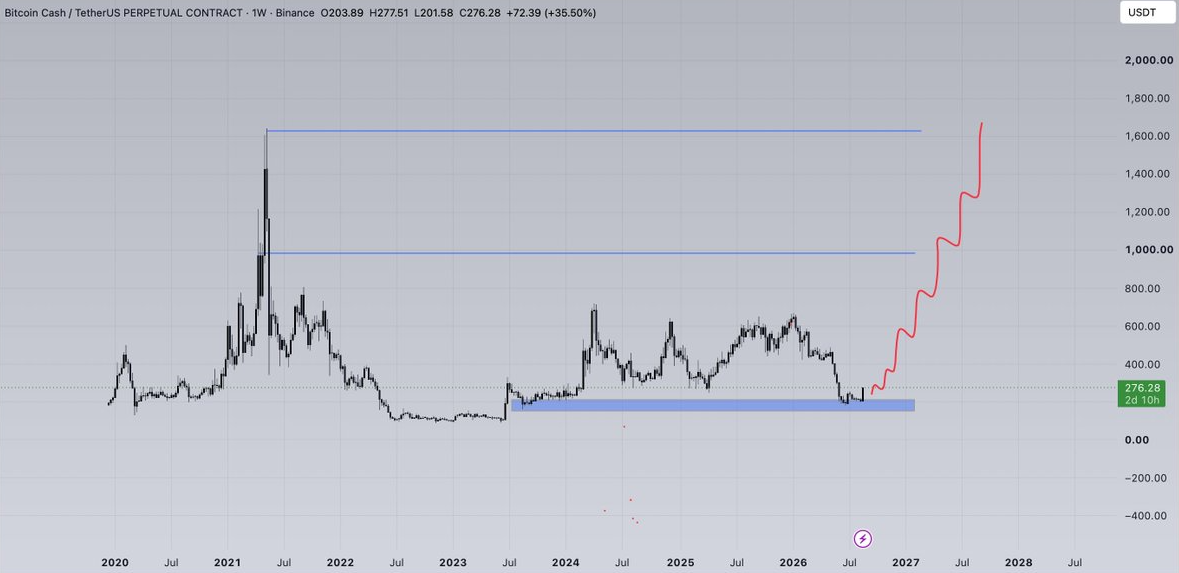
Source: Data From X
Note: This is an unverified trader chart, not confirmed analysis, and should be treated as one trader's outlook rather than fact.
Bitcoin Cash Forecast: Bull Case vs Bear Case
Bull case: Holding above $264.60 keeps the breakout structure intact.
A confirmed close above $308.08 would open the path toward $351.11 and then $380.18.
Bear case: A break below $264.60 would suggest today's spike was a leveraged squeeze rather than a real trend shift.
Losing $250.12 would put the entire breakout in question given how overbought RSI already is.
$BCH Price Prediction Scenarios 2026
Scenario | Trigger | Likely Outcome | Invalidation Point |
Breakout continuation | Close above $308.08 | Move toward $351.11 | Rejection at $308.08 |
Range hold | Price holds 264.60–308.08 | Consolidation before next leg | Break outside either bound |
Breakout failure | Close below $250.12 | Retest of EMA zone near 224–226 | Reclaim of $264.60 |
Bitcoin Cash Price Prediction: Can $BCH Reach $500?
$500.49 is the highest resistance marked on the chart.
Getting there would require $BCH to clear $308.08, $351.11, $380.18, and $435.78 in sequence, a long multi-stage move rather than a single leg, especially with RSI already stretched at 78.63.
Bitcoin Cash Price Prediction 2026: Expert View
According to CoinGabbar analysts, today's spike came with heavy volume, but the pullback from the day's high combined with long-side liquidations tells a mixed story, part genuine breakout, part leveraged squeeze.
RSI above 78 is a clear caution flag after such a sharp move.
The $264.60 to $308.08 zone is the one to watch over the next few sessions to see whether buyers can hold their ground.
Disclaimert: This piece is for informational purposes only and isn't financial advice. The levels and scenarios above are based on technical chart analysis and publicly available data at the time of writing, and crypto markets can move sharply within hours, so past patterns don't guarantee future outcomes. Social media charts referenced here are unverified opinions, not confirmed data. It's worth doing independent research and considering your own risk tolerance before acting on any of the levels discussed here.











.webp)





