Chump Coin Price Prediction: Why Did CHUMP Fall 7% Today?


This Chump Coin Price Prediction looks at why CHUMP has slipped today after a strong run higher over the past few weeks. Chump Coin launched in August 2026 as a satirical meme token on the Robinhood Chain, built around a political parody theme and a mascot styled as a chicken in a suit.
CHUMP is currently trading at $0.03493 at the moment, down 7.0% over the last 24 hours, moving inside a $0.03232 to $0.03981 range, with a market cap of $34.93M.
Live Market Data
| Metric | Value |
| Price | $0.03493 |
| Market Cap | $34.93M |
| Fully Diluted Valuation | $34.93M |
| 24-Hour Trading Vol | $5.022M |
| Circulating Supply | 1B |
| Total Supply | 1B |
| Max Supply | 1B |
Source: $CHUMP market data taken from CoinGecko, as of Sep 8, 2026. Figures may vary slightly across other tracking websites.
Why Is $CHUMP Down Today?
There's no single negative headline behind today's move. $CHUMP is still trading well below the all-time high it set earlier this month during its initial rally, and today's decline looks like a continuation of that broader pullback rather than a reaction to fresh news.
With a market cap still under $35M and daily volume in the low single-digit millions, $CHUMP's liquidity remains thin, and thin liquidity tends to magnify price swings in both directions, something worth keeping in mind alongside the chart levels below.
CHUMP News Today: Community Sentiment Around $CHUMP
Traders Eye Rising Community Interest
One trader posting under the handle B1 described $CHUMP as still having a small market cap relative to its growing community attention, arguing that a pickup in real trading volume could move price quickly from here.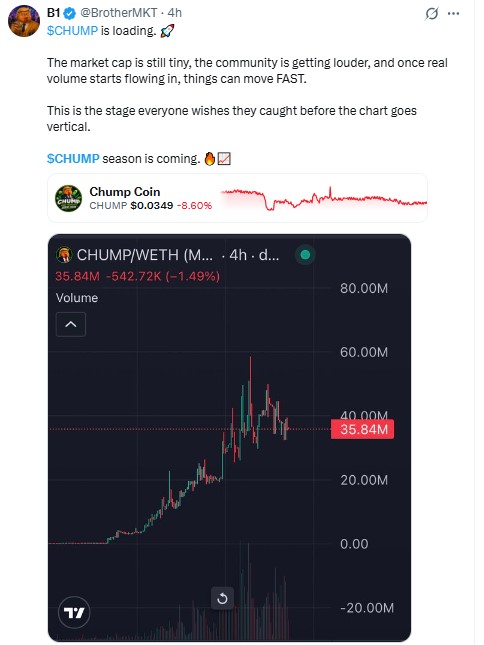
Source: Data Taken From @BrotherMKT , X Account.
The post framed the current stage as an early one for the token.
It's worth treating that kind of community sentiment as one input among many rather than a signal on its own, especially for a token this new and this thinly traded.
Chump Coin Price Prediction: Technical Outlook
On the 4-hour CHUMP/USD chart on Uniswap V3 via GeckoTerminal, price has been sliding lower inside a descending channel since early September, pulling back from its recent highs.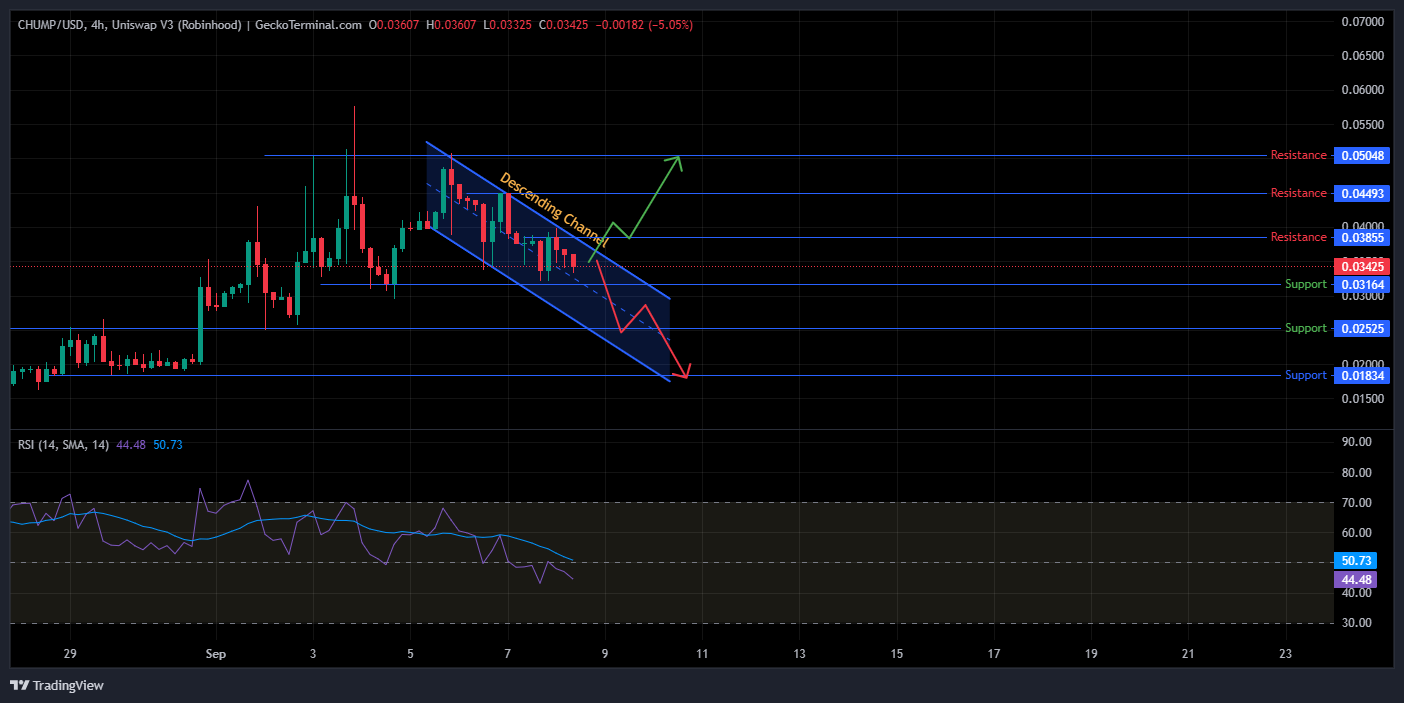
Source: Chart Taken From Uniswap V3 via GeckoTerminal .
$CHUMP is currently trading near the dotted reference line at $0.03425, close to the middle of that channel.
RSI sits at 44.48, just below its 14-period moving average of 50.73, reflecting the cooling momentum behind this pullback.
Could CHUMP Break Toward Higher Resistance?
If CHUMP breaks above the descending channel's upper boundary with a strong 4-hour close and rising volume, the first target becomes $0.03855.
Clearing that on continued volume opens the path to $0.04493, with $0.05048 as the next resistance if buying pressure extends further.
What Happens If CHUMP Breaks Support?
If instead the price slides down to test support and breaks below it with volume confirming the move, $0.03164 becomes the first level to watch.
A failure to hold that could send $CHUMP toward $0.02525, and continued selling would put $0.01834 in view.
Support and Resistance Levels
| Support | Resistance |
| $0.03164 | $0.03855 |
| $0.02525 | $0.04493 |
| $0.01834 | $0.05048 |
Bull, Base, and Bear Scenarios
| Scenario | Setup | Level |
| Bull | Break the above channel resistance on volume. | $0.03855–$0.05048 |
| Base | Price consolidates within the descending channel. | $0.0316–$0.0386 |
| Bear | Break below channel support on volume. | $0.03164–$0.01834 |
Glossary
A descending channel forms when price moves lower between two parallel, downward-sloping lines, and it tends to stay intact until either a strong close above the upper line or a break below the lower one changes the picture.
RSI measures how fast and how far price has moved recently, which is why traders lean on it to spot when momentum is fading, like it appears to be doing here.
Support and resistance are the price zones where buying or selling has stepped in with enough force before to pause or reverse a move, and for a low-liquidity token like $CHUMP, those reactions can happen more abruptly than they would on a larger, more established coin.
CHUMP vs Bitcoin
As a newly launched, small-cap token, CHUMP's price behavior is shaped more by its own thin liquidity and community activity than by Bitcoin's broader moves.
That said, a sharp shift in overall market sentiment, positive or negative, tends to filter down to smaller tokens like $CHUMP even faster than it does to larger, more liquid coins.
Methodology
This Chump Coin Price Prediction is based on 4-hour candlestick data from GeckoTerminal, RSI readings, and the descending channel structure visible on the chart since early September 2026.
The scenario levels above depend on confirmed breakout or breakdown conditions and are not guaranteed outcomes, an important caveat for a token this new and this thinly traded.
Expert Opinion
Market commentators tracking CHUMP note that today's decline fits a pattern common to newly launched meme tokens, where an initial rally is followed by a multi-week pullback as early buyers take profit.
They caution that CHUMP's low trading volume and small market cap mean price swings, in either direction, can be sharper and less predictable than on more established tokens, and that any breakout or breakdown here should be weighed with that added volatility in mind.
Disclaimer: This Chump Coin Price Prediction is for informational purposes only and should not be treated as financial advice. CHUMP is a newly launched, low-liquidity token, and cryptocurrency markets in general are highly volatile. Technical patterns can fail to play out as expected, and any of the scenarios described above carry a realistic probability of not occurring, with downside risk potentially exceeding the levels outlined here. Readers should conduct independent research before making any investment decisions.

















