Hyperliquid Price Prediction: Will $HYPE Become the Next DeFi Giant?


HYPE's parked right under a line that's been holding it back for a while.
Nothing wild happening today, just sitting near $55, basically flat. But that line is the whole story right now.
Clear it with decent volume, and this Hyperliquid price prediction turns bullish fast.
Get rejected again, and the price probably drifts lower before another attempt.
Live Market Data
HYPE is currently trading at $55.60, down 0.9% on the day, ranging between $54.70 and $56.45. 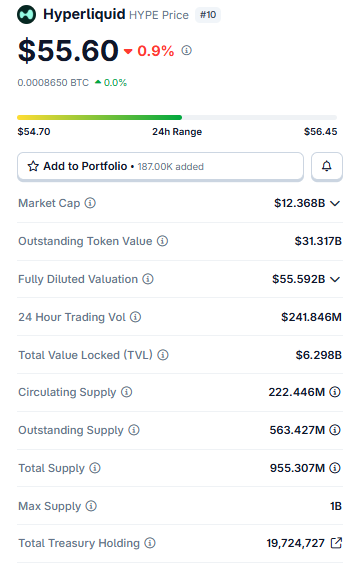
Source: $HYPE Market Cap Data Taken From Coingecko, data as of Aug 07, 2026. Figures may vary slightly across other tracking websites.
Market cap's at $12.368B, but fully diluted value jumps way up to $55.592B, a gap that big tells you most of the 955.307M total supply, out of a 1B ceiling, hasn't hit the market yet. Circulating supply sits at 222.446M.
Volume over the past day came to $241.846M, and $6.298B is locked up on the platform itself.
Liquidation Snapshot
The liquidation heatmap and longs have taken most of the damage lately. $874.58K was wiped out there over 24 hours, versus $362.04K on shorts.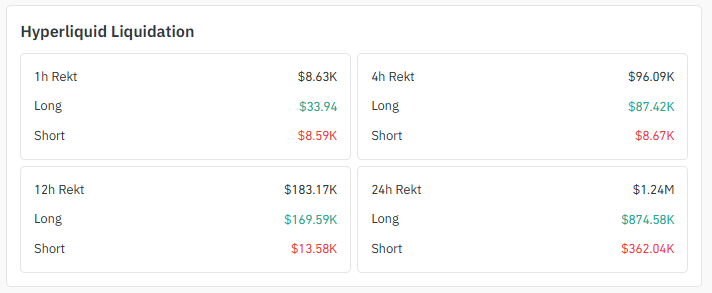
Source: Liquidation Data Taken From Coinglass.
That kind of flush usually shows up when leveraged buyers get a little too eager right into resistance, and yeah, that lines up with what's happening at this trendline right now.
Exchange Volume Data
Where's it all trading? Binance, mostly, has $412.61M in 24-hour futures turnover there alone.
LBank's not far off at $315.27M, Hyperliquid's own platform pulls $219.89M, and MEXC closes behind at $209.63M. 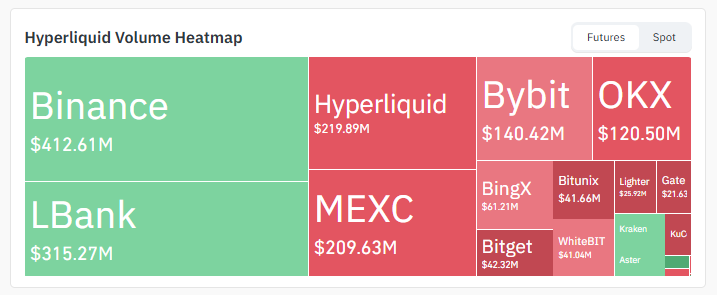
Source: Volume Heatmap Data Taken From Coinglass.
Bybit and OKX each cross $100M too. Spread that wide, and it's clearly not one exchange pushing the number around, real demand across the board.
Social Sentiment
The burn keeps ticking along quietly in the background.
Latest numbers show another 1.28 million $HYPE gone in a single day, paid for straight out of trading fees, pushing the running total past 47.5 million tokens burned, close to 4.75% of the whole max supply.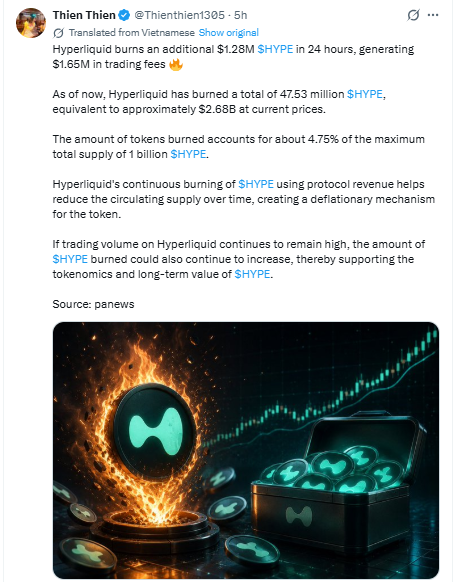
Source: Data Taken From @Thienthien1305 , X Account.
That's a genuine deflationary mechanic, not just marketing talk, and if trading volume keeps climbing, the burn pace should follow.
Quietly, that backs the longer-term case behind this Hyperliquid price prediction, chart aside.
Key Takeaways
-
HYPE's at $55.73, barely moved today, pressed right up against a falling trendline on the 4H chart.
-
Snap that line with real volume behind it, and $60.31 shows up first, $63.46 after that.
-
Get turned away again, and the price probably slides back toward $53.65, maybe $51.29.
-
The daily chart is a bigger version of the same story, a falling channel with $62.60 and $76.86 up top and $48.07 and $38.90 down below.
-
Hyperliquid's still burning HYPE off trading fees; past 47.5 million tokens are gone now.
4H Chart: Falling Trendline
Look at the 4H chart , and the price has been grinding upward into a descending trendline for a bit now, finally close enough to actually test it. 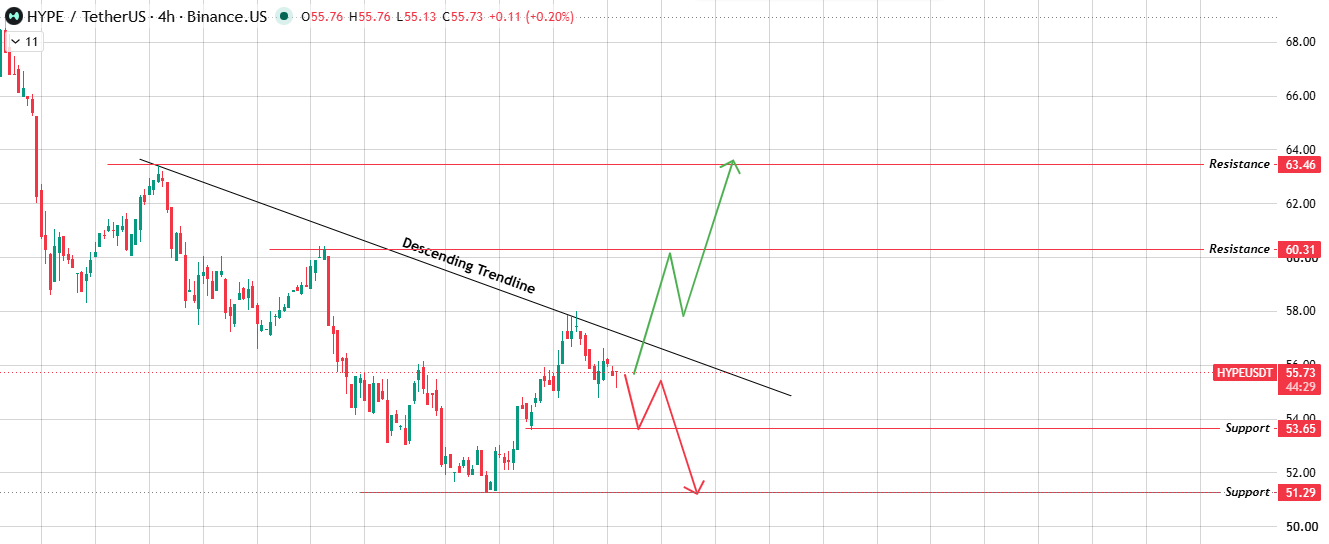
Source: Chart Taken From TradingView.
Clear break above this line on strong volume, and $60.31 comes first, with $63.46 in play after.
Get pushed back here, though, like it's happened before, and expect a drop toward $53.65, possibly $51.29 if sellers keep leaning on it.
1D Chart: Falling Channel
Pull back to the daily, and it's the same story, just bigger. $HYPE's been sliding down a descending channel for weeks, bouncing between two parallel lines heading lower. 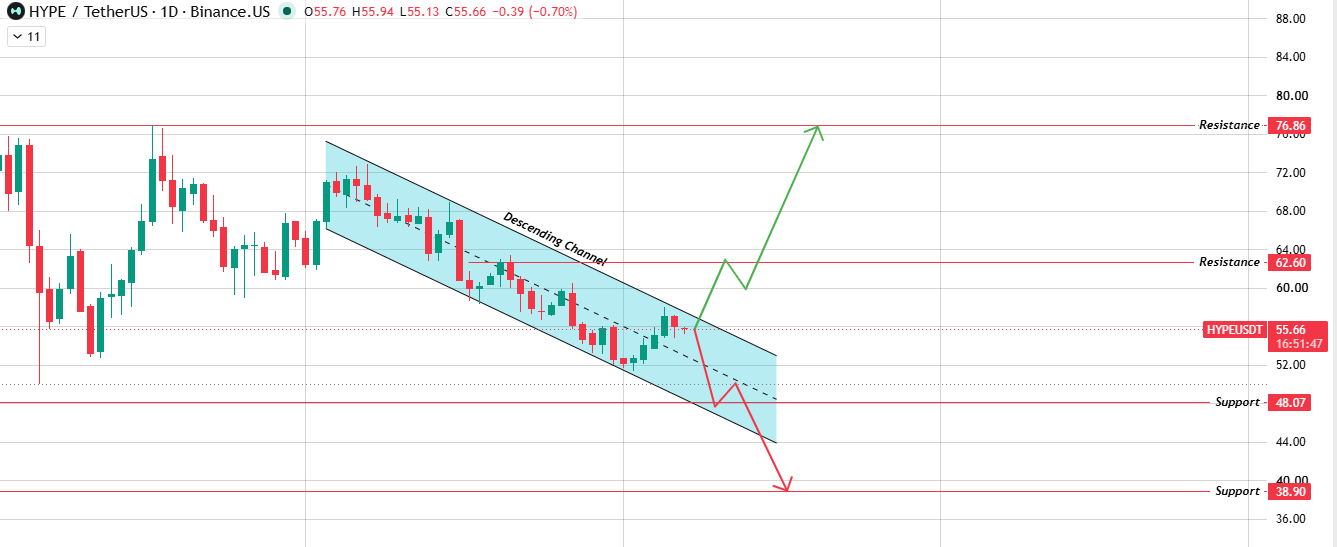
Source: Chart Taken From TradingView.
Break the top boundary of that channel with volume, and $62.60 opens up, with a much bigger jump toward $76.86 possible if the whole trend actually reverses.
Break the bottom instead, and $48.07 is next, $38.90 further down if things really unravel.
Bull, Base, and Bear Scenarios
Risks
Nothing trades in isolation, HYPE included.
Let BTC dominance swing hard enough, and it could override whatever this trendline is saying.
Breakouts fail plenty too, so it's worth waiting on real volume before trusting any single candle through the line.
Glossary
Descending Trendline: Connect a series of lower highs, and you get this, usually acting as a ceiling until price finally punches through.
Descending Channel: Two falling lines running in parallel, price bouncing inside them, a sign the downtrend hasn't broken yet.
Liquidation Heatmap: Basically a map of where leveraged trades got forced shut when price moved against them.
Methodology: Levels in this Hyperliquid price prediction come straight from TradingView chart analysis on the 4H and 1D timeframes, plus liquidation, volume, and market data pulled at the time of writing. Numbers can shift as the market does.
Disclaimer: This article is for informational purposes only and does not constitute financial advice. Cryptocurrency markets are highly volatile and speculative. Always do independent research and speak with a licensed financial advisor before making investment decisions
















