Orochi Network Price Prediction 2026: Can $ON Reclaim $0.36?


Something changed for a token most traders had written off, and it happened fast enough that even old holders are checking the chart twice. Orochi Network price prediction searches spiked this week as the coin went from a name buried in low-cap lists to one of the loudest tickers on trending boards, and the move caught a lot of people off guard. It's the kind of run that either marks the start of something bigger or the top of a trade that got crowded too fast. Which one is it? The chart itself is sending mixed signals depending on which timeframe you're looking at, and that's exactly what makes this one worth breaking down properly.
Why Is Everyone Searching Orochi Network Price Predictions Again?
Interest in Orochi Network price prediction queries has climbed hard this week, and it's not hard to see why once you look at what's moving underneath.
The Orochi Network price today sits far above where it traded a month ago, and that jump alone explains most of the search spike.
A token most people stopped tracking after its early listing cooled off just forced its way back into trending lists and group chats.
That kind of comeback rarely happens for no reason, and we walked through the setup building toward it in our earlier breakout analysis.
Wallet activity picked up, exchange coverage around the token got busier, and the wider zero-knowledge crypto and ZK oracle network narrative found a fresh spotlight.
Orochi Network's Web3 infrastructure token positioning got pulled along with that spotlight too.
But comebacks like this also invite skepticism, especially from anyone who's watched a similar low-cap crypto spike fade just as fast as it started.
So the real question isn't whether Orochi Network moved. It's whether this move has enough underneath it to keep going or whether it's about to give it all back.
Key Takeaways
ON trades near $0.297, still up sharply on the day after a weekly gain that topped 130%.
Daily RSI reads 69.30, brushing overbought; weekly RSI runs even hotter at 73.61.
Daily resistance stacks at $0.365, then $0.419 and $0.515. Support holds at $0.172, backed by $0.128 and $0.080.
24-hour liquidations hit $3.94M, split $1.36M long against $2.58M short, a sign that shorts are still eating the bigger hit.
Holder concentration is extreme: the top 100 tracked wallets hold 99.99% of supply, with a Gini score of 0.9881.
The all-time high sits at $0.3963 from October 2025. Today's high near $0.359 puts ON within reach of that level again.
Orochi Network Price Prediction: What the Charts Show Right Now
Here's the thing: the daily chart and the weekly chart aren't quite telling the same story, even though both are green.
One shows a parabolic breakout. The other shows a token still cooling from a much bigger spike.
Turns out both can be true. A vertical weekly move, followed by a shaky daily pullback. This is where a proper Orochi Network technical analysis has to separate the noise from the signal.
Daily Chart: Orochi Network Technical Analysis
$ON opened near $0.348 today and slipped toward $0.297, down about 15% on the candle, per TradingView chart data. The 50 EMA sits far below spot at $0.126, so the broader trend is still pointed up even with today's red candle.
Daily RSI reads 69.30. Firm. Getting close to being stretched.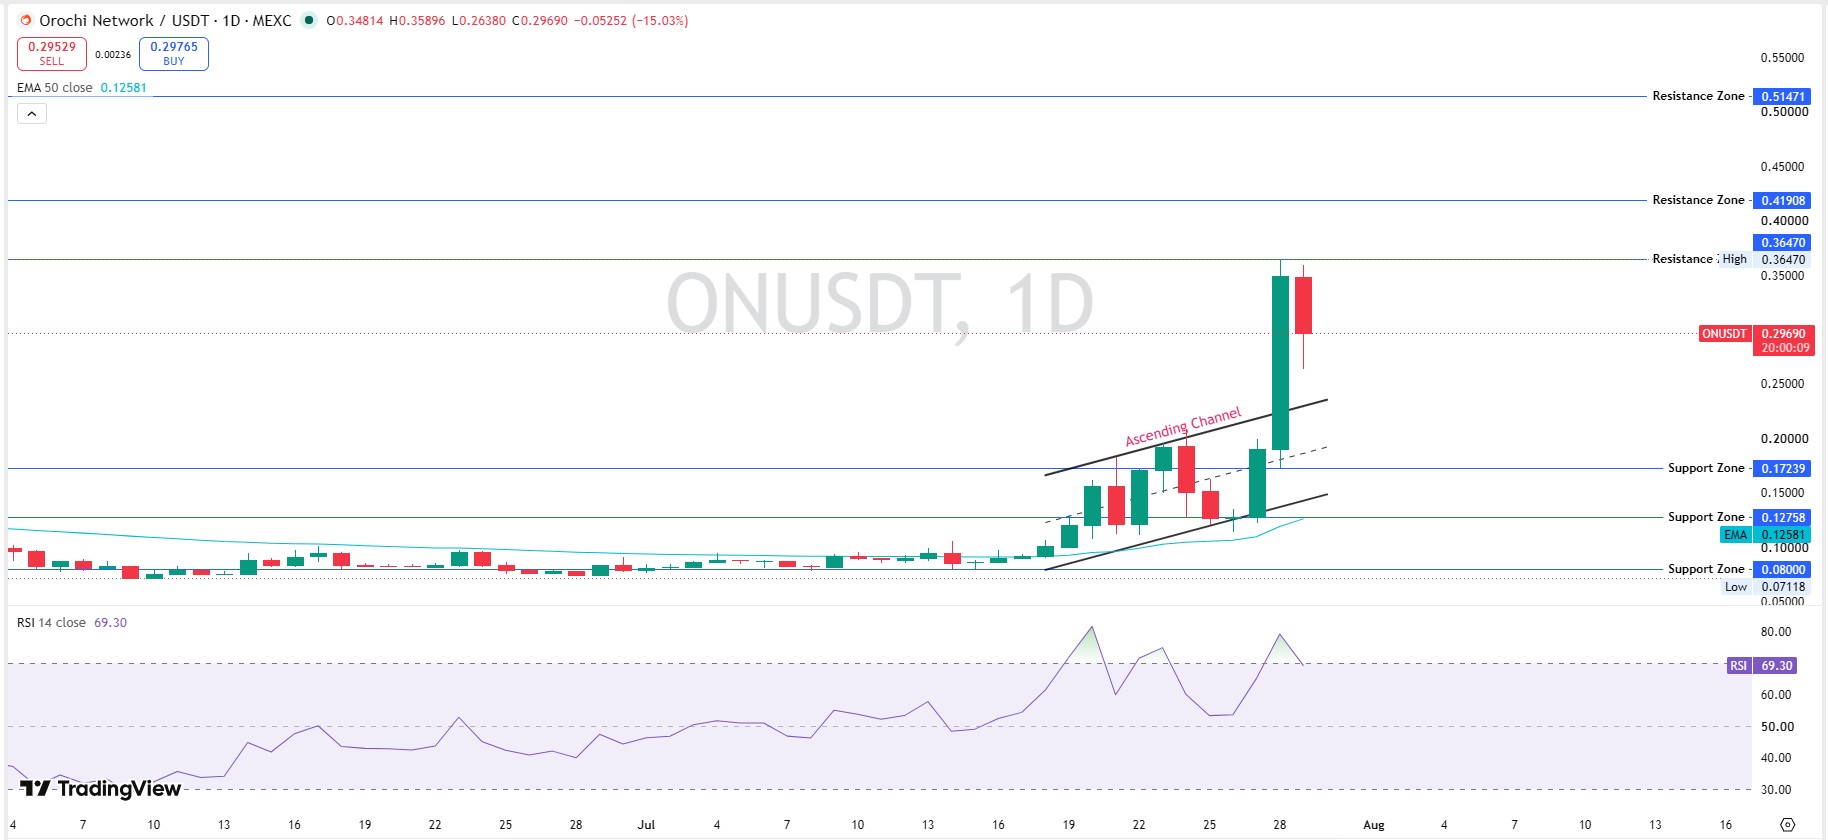
Price had been riding an ascending channel through most of July, a setup we mapped out in our ascending channel breakout coverage, before this week's candle broke sharply above it.
Resistance sits at $0.365, then $0.419 and $0.515. Support underneath holds at $0.172, backed by $0.128 and a deeper floor near $0.080.
Weekly Chart: Orochi Network Price Analysis
Zoom out and the picture gets louder, not calmer. This week's candle is up over 130%, breaking clean out of a rectangle range that had held since late last year.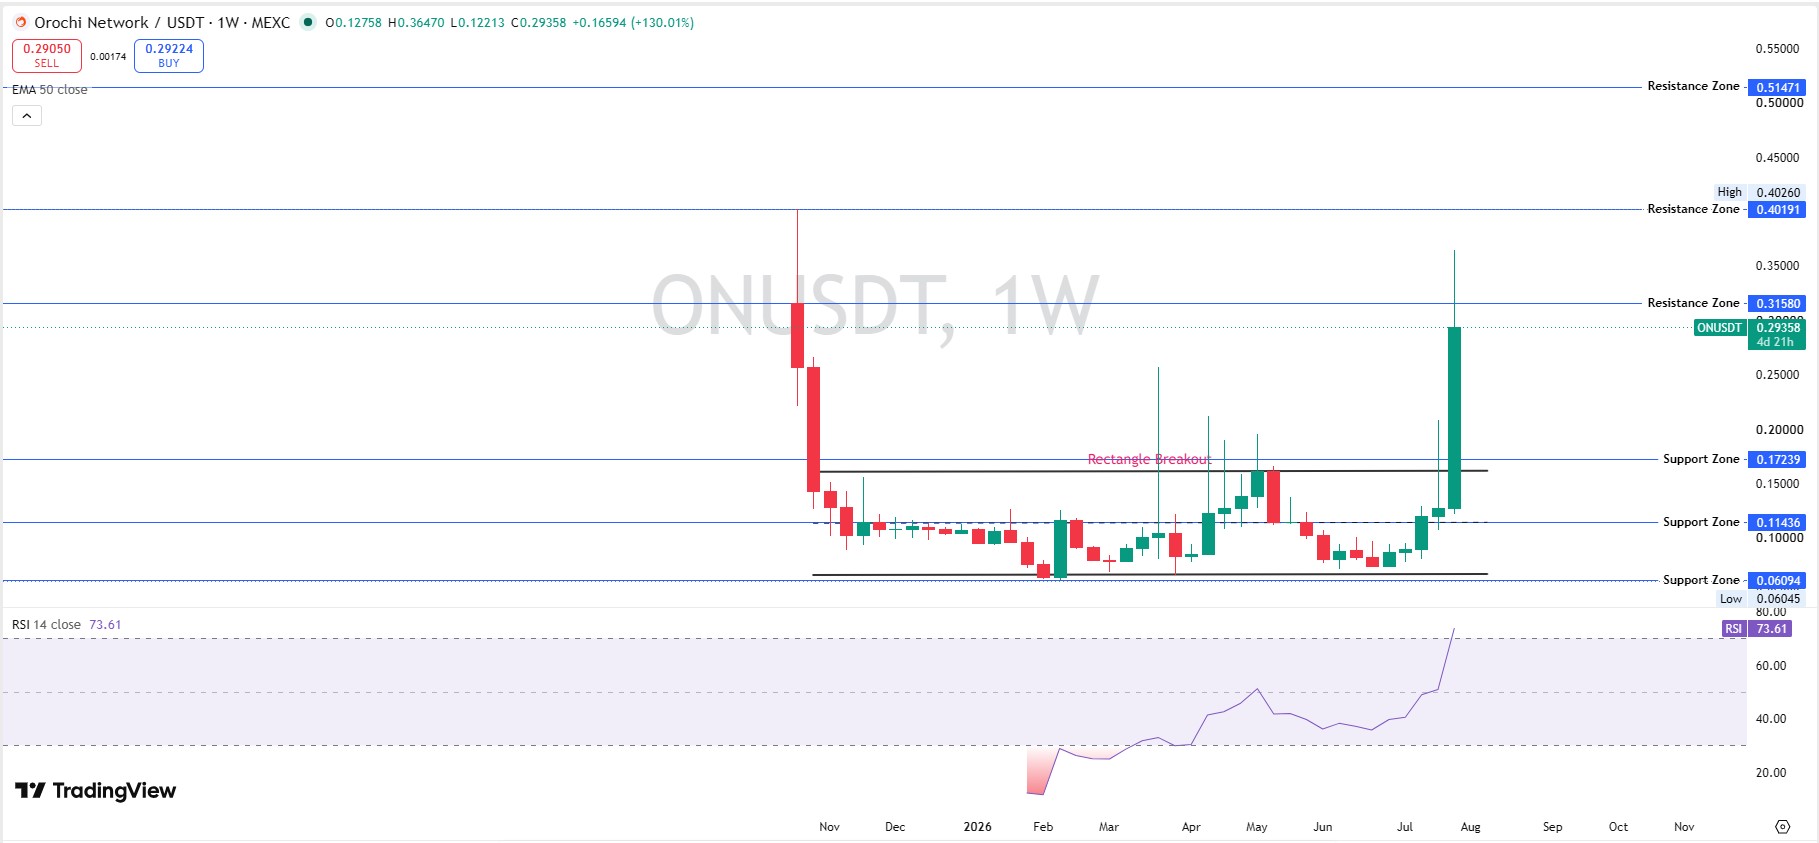
Weekly RSI sits at 73.61, firmly overbought.
Weekly resistance stacks at $0.402 and then $0.515, both levels the token hasn't tested since its October listing spike, a move we broke down in our Binance Alpha Box rally piece.
The Liquidation Snapshot
Shorts have been paying the most, and it isn't close.
1-hour liquidations: $153.10K, split $44.66K long against $108.44K short. 4-hour: $888.31K, with $499.71K long against $388.60K short. 24-hour: $3.94M total, $1.36M long against $2.58M short, per Coinglass liquidation data.
That flip matters. Early momentum usually squeezes shorts first, but here shorts are still absorbing more damage even after the daily pullback.
Longs are starting to feel it too, though, especially in the 4-hour window. That's worth watching into the next session, too.
$ON Token Analysis: Holder Concentration Tells Its Own Story
ON's supply sits in very few hands. Etherscan holder data shows the top 100 wallets control 99.99% of tracked supply, with a Gini score of 0.9881, close to maximum inequality.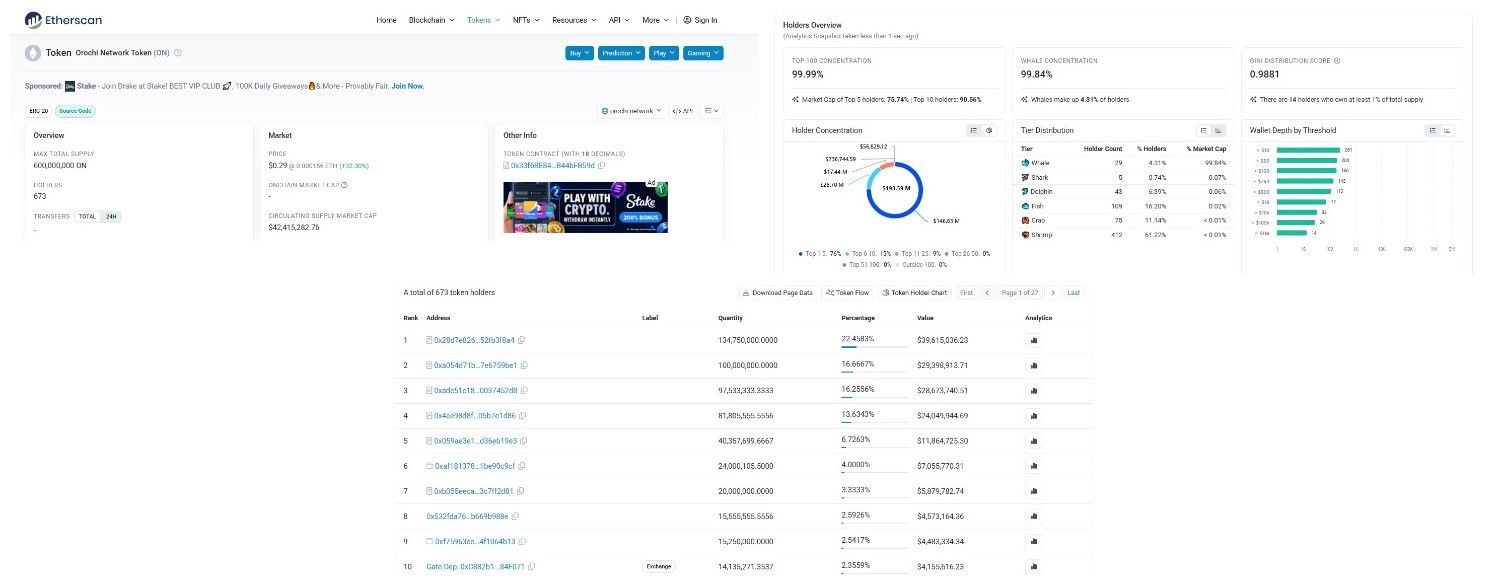
The largest wallet alone holds roughly 22.46% of tracked tokens, and the five largest tracked addresses collectively hold approximately 75.74% of tracked token supply.
Whales make up just 4.31% of holders but 99.84% of value, per wallet-tier analytics. Everyone else, the shrimp and crab tiers, holds well under 1% combined.
We pulled the futures heatmap too. Binance dominated reported ON derivatives turnover in this snapshot, with $549.25M in 24-hour futures volume well ahead of MEXC's $55.28M and Bitunix's $28.00M. This may increase the influence of Binance futures order flow, but spot liquidity should be assessed separately.
According to CoinMarketCap, circulating supply sits near 144.27M ON against a total supply of 700M, with volume-to-market-cap running above 159%. Turnover this heavy, on a token this concentrated, tends not to stay calm for long.
This kind of concentration pattern shows up across altcoin technical analysis more broadly, not just here.
Heavy reliance on one venue also raises exchange listing risk, since any change in that flow shows up in price fast.
Orochi Network Forecast: Bull, Base, Bear
None of this is financial advice, just scenario ranges built from current structure. Check the wider Bitcoin price prediction 2026 outlook for broader market context too.
Bull: A daily close above $0.365 opens room toward $0.419 within 7 to 14 days. Probability near 30%. Invalidation: a close back below $0.28.
Base: Price chops between $0.172 and $0.365 for 7 to 30 days. Probability near 45%.
Bear: Daily close below $0.172 opens a retest toward $0.128 and then $0.080. Probability near 25%. Invalidation: ON reclaims $0.28 and sustains daily closes above it.
Key Risks
Weekly RSI is already overbought, which leaves little room for another leg without a cooldown first.
Whale concentration near 100% of tracked wallets is the single biggest structural risk here.
Exchange volume also leans almost entirely on Binance, so any pullback in that flow could hit price fast. And with the token still 25% off its October all-time high, chasing this move at the top carries real downside if momentum stalls.
Wider market swings can override any single token's setup too, so it's worth checking the latest Ethereum price prediction 2026 alongside this one.
Orochi Network Market Outlook
Zooming out, the Orochi Network market outlook splits pretty cleanly by timeframe.
Short-term: the Orochi Network short-term price prediction leans on that daily chart. A close above $0.365 keeps the bulls in control into next week.
Weekly: The Orochi Network weekly price prediction is murkier since RSI at 73.61 usually cools off before it climbs further, even inside an uptrend.
Long-term: an Orochi Network long-term forecast has to weigh the token's still-thin trading history against its extreme holder concentration, so treat any multi-month call here as a low-confidence one until supply data gets less top-heavy.
What to Watch Next
Keep an eye on a daily close above $0.365. That's the level that opens the door toward $0.419.
Watch whether weekly RSI cools from overbought without a hard reversal, since that would support the base case over the bear case.
Liquidation flow is worth tracking too. If shorts keep absorbing the bigger share, dips may keep getting bought, and any fresh catalyst will likely show up first on the coin events calendar.
For anything faster-moving than this snapshot, ON coin news and broader Orochi Network crypto news tend to break on exchange social accounts before they hit any chart.
Disclaimer: This article is for informational purposes only and does not constitute financial advice. Cryptocurrency markets are highly volatile. Always do your own research and consult a licensed financial advisor before making investment decisions.









.jpg)








