Stellar Price Prediction September 2026: Can XLM Hit $0.50?


This Stellar price prediction September 2026 lands at a moment when XLM's chart just did something it wasn't supposed to do.
A resistance zone that had held for months, one that traders had all but written off as unbreakable, finally cracked, and the way it gave way is turning heads across trading desks.
What looked like just another failed attempt at the line has instead flipped into one of the more compelling setups XLM has produced in a while.
Add to that a fresh wave of real-world relevance building around Stellar's network, and this update carries more weight than a typical chart check-in. Here's what's unfolding and why it matters right now.
Stellar Price Today: Live Data and 24-Hour Change
XLM is trading near $0.18434 on the daily chart.
Separate live data from CoinGlass puts the coin around $0.18421, down close to 6.98% over the past 24 hours, with futures volume of $193.55 million against spot volume of $79.88 million and open interest at $183.50 million.
Market cap stands at $6.37 billion on a circulating supply of 34.60 billion XLM out of a fixed total and max supply of 50 billion tokens, meaning roughly 15.4 billion XLM remain outside circulation.
Source: TradingView (XLM/USDT perpetual, Binance, daily chart) and CoinGlass, both accessed August 25, 2026, IST.
Stellar News: Tokenized Government Debt Leadership
An X post from finance commentary account @Xfinancebull, published roughly two hours before this piece, tracked Stellar's growth in tokenized non-US government debt from close to $9 million in late 2025 to nearly half a billion dollars by August 2026, a run that still keeps the network in the top spot for that category.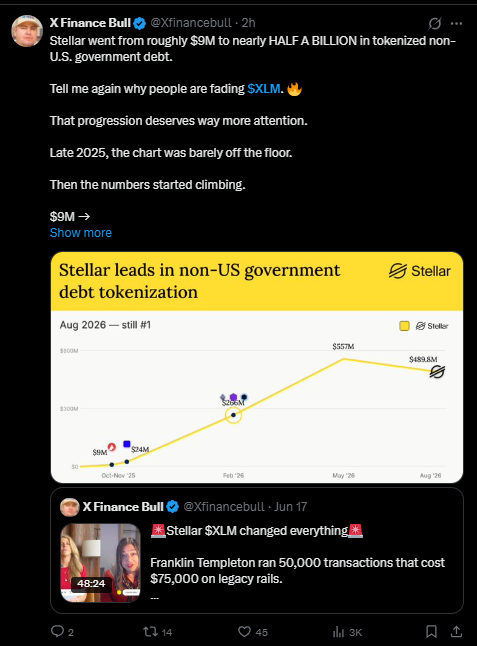
The accompanying chart shows the total climbing sharply through February and May before settling near $489.8 million in August, a slight pullback off its recent peak but still an enormous multiple of where it started less than a year earlier.
The same thread referenced Franklin Templeton's use of Stellar rails for tens of thousands of transactions at a fraction of what those settlements would cost on legacy infrastructure, reinforcing the argument that institutional players are treating Stellar as working payments and settlement plumbing rather than a speculative sideline.
Source: X post by @Xfinancebull, posted roughly 2 hours before this piece, August 25, 2026.
Quick Take
CMP: $0.18434
Daily trigger: close above $0.20025, open $0.25144, then $0.29802
Daily failure: close below $0.15217 invalidates the bullish structure
Data as of August 25, 2026, IST
Short risk note: these levels come from the daily chart and depend on confirmed daily closes, not intraday wicks.
Leveraged positions around these zones carry liquidation risk if price whipsaws before a level is confirmed.
Stellar Technical Forecast September 2026
The setup here is less about a clean breakout and more about a failed breakdown.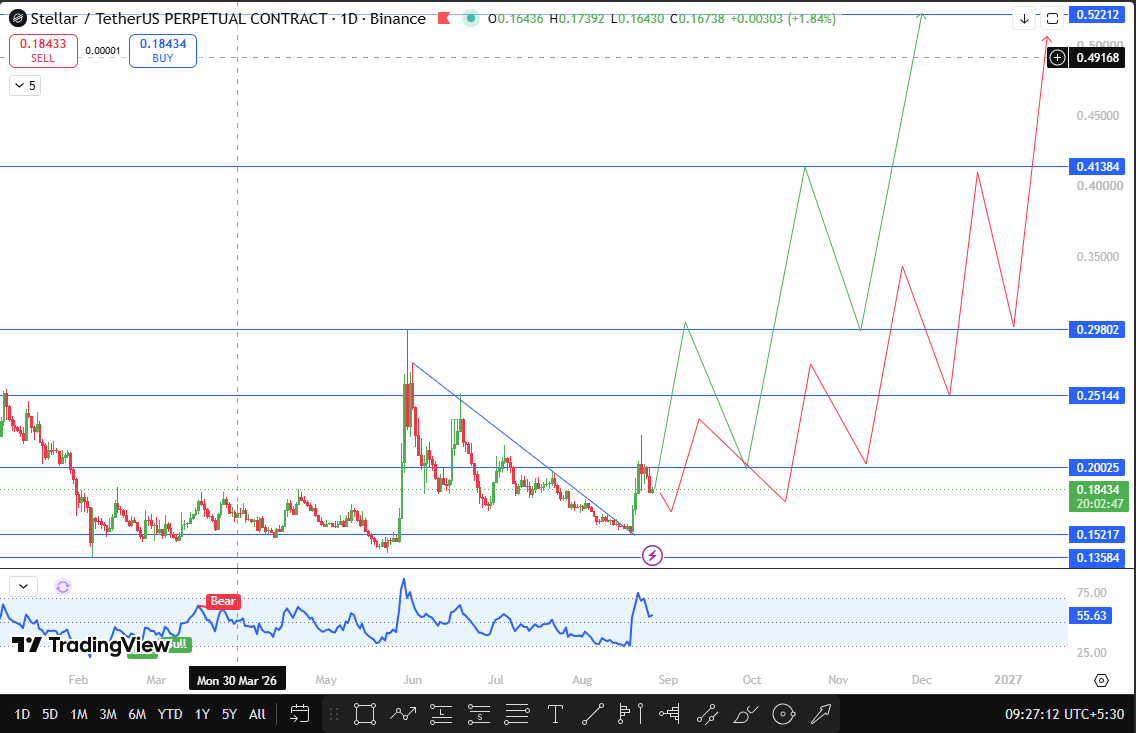
XLM had been grinding lower along a descending trendline for months, the kind of structure that usually resolves with an aggressive move to the downside once price finally tests the line.
That is not what happened. Every time the price pushed up into that trendline, the selling pressure showed up noticeably weaker than the prior test, almost as if sellers were running out of ammunition rather than reloading it.
That pattern repeated enough times that the price started sustaining near the trendline instead of getting rejected hard, and the selling itself slowed into something closer to drift than decline.
When the break finally came, it came fast, a sharp move that cleared the descending structure in a way that looked more decisive than defensive.
If XLM breaks and closes a daily candle above $0.20025, roughly 8.63% above the current price, it opens the door to $0.25144 as the next resistance, a level about 36.40% higher than where the price sits now.
Beyond that, $0.29802 stands out as the next swing high on the chart, sitting close to 61.67% above current price, with $0.41384 and the major resistance at $0.52212 as the extended targets further out, representing gains of roughly 124.51% and 183.28% from current levels, respectively, if the rally carries that far.
On the downside, a daily close below $0.15217, about 17.46% under current price, would invalidate this bullish structure, suggesting the breakout was a temporary liquidity grab rather than a genuine trend change.
A deeper break below $0.13584, close to 26.31% under current price, would confirm that read.
Source: TradingView, XLM/USDT perpetual chart, 1-day timeframe, Binance, captured August 25, 2026, IST.
XLM Support and Resistance Levels to Watch
Level Type | Price | Change from CMP | Note |
Support | $0.13584 | -26.31% | Deeper swing low if the trendline breaks |
Support | $0.15217 | -17.46% | Daily close below this invalidates the bullish setup. |
Resistance | $0.20025 | +8.63% | Daily close above this confirms continuation. |
Resistance | $0.25144 | +36.40% | First target after breakout confirmation |
Resistance | $0.29802 | +61.67% | Prior swing high, second target |
Resistance | $0.41384 | +124.51% | Extended target if momentum holds |
Resistance | $0.52212 | +183.28% | Major resistance, prior swing high |
Stellar Price Prediction: Bull, Base, and Bear Cases
The base case has XLM consolidating just above the breakout zone through much of September, without a confirmed daily close above $0.20025 or below $0.15217, essentially digesting the recent move before committing to a direction.
The bull case activates on a daily close above $0.20025, which opens a path toward $0.25144 and eventually $0.29802. This case gets extra support from Stellar's growing footprint in tokenized government debt, which adds real institutional demand alongside the technical setup rather than relying on speculation alone.
The bear case needs a daily close below $0.15217, which would suggest the trendline break was a fakeout rather than a genuine shift in structure, putting the $0.13584 swing low back in focus.
Every one of these Stellar price prediction September 2026 scenarios depends on a confirmed daily close, not a temporary wick through any level.
On-Chain and Fundamental Drivers
Stellar's core pitch has always centered on cheap, fast settlement, and that pitch is increasingly showing up in real usage rather than just marketing.
The network's growing role in tokenized real-world assets, particularly non-US government debt, gives XLM a use case that does not depend on retail trading volume to stay relevant.
Institutional participants moving transaction volume onto Stellar rails, at costs far below traditional settlement systems, adds a demand source that tends to be stickier than speculative flow.
That said, fundamentals like this tend to move slowly and rarely drive short-term price action on their own.
The current breakout looks primarily technical in nature, with the fundamental backdrop acting as a supporting narrative rather than the immediate trigger.
September 2026 Catalysts
Traders will likely be watching whether Stellar's tokenized debt figures keep climbing from their current $489.8 million level or continue to soften off the May peak.
Any fresh announcements from institutional partners already using Stellar rails, along with broader movement in Bitcoin dominance and overall crypto liquidity, could meaningfully influence whether XLM holds its breakout through the month.
Risks That Could Invalidate This Forecast
This bullish setup fails if XLM cannot close a daily candle above $0.20025 and fails more seriously if the price closes below $0.15217, which would suggest the descending trendline break was a temporary liquidity grab rather than a genuine structural shift.
Broader risks include a slowdown in Stellar's institutional tokenization activity, shifts in Bitcoin dominance, macro liquidity conditions, and general crypto market volatility, any of which could override Stellar's own chart structure regardless of where its trendlines sit.
Glossary
Descending trendline: a downward-sloping line connecting a series of lower highs, used to track a prevailing downtrend
Trendline breakout: a move where price closes beyond a trendline that had previously acted as resistance or support
Daily close: the final traded price when a daily candle finishes, used to confirm whether a breakout or breakdown is genuine
Open interest: the total number of outstanding futures or options contracts that have not yet been settled
Support: a price zone where buying pressure has previously stepped in
Resistance: a price zone where selling pressure has previously capped upside
Invalidation level: the price point at which a forecast scenario is considered incorrect
Real-world asset Tokenization: the process of representing traditional financial instruments, such as government debt, as blockchain-based tokens
Disclaimer
This article is for informational purposes only and does not constitute financial advice. Cryptocurrency markets are highly volatile, and all price levels discussed are based on technical chart analysis, not a guarantee of future performance. Readers should conduct their own research before making any investment decisions.

















