XRP Key Support Levels: Bulls Eye $1.26, But $1.15 Must Hold


XRP clawed back to around $1.14 on June 12, after dipping as low as $1.05 earlier in the session. The bounce gave bulls something to work with, but it has not changed the bigger picture much.
The latest XRP key support levels are now in focus as traders assess whether the rebound can extend toward$1.1938 and $1.26. For the broader XRP price prediction 2026, the ability to hold support whilereclaiming key moving averages could determine whether this is a temporarybounce or the start of a stronger recovery.
XRP price today: what is happening right now
The token is still stuck under a falling trendline that has been in place since early 2026, according to the chart. That trendline has capped almost every rally attempt for months.
From an $XRP analysis today perspective, the $1.1340–$1.1408 zone is the immediate decision area.
Asustained move above it could improve the short-term $XRP forecast, while a breakdown would put the lower support levels back in focus.
As per the Egrag Chart, on the 1-hour chart, the altcoin is holding in a tight band between $1.1340 and $1.1408. Traders seem to be treating this zone as the line in the sand. Hold it, and buyers stay in charge for now. Lose it, and the bounce could fade fast.
Why is XRP price falling below key moving averages
Data on the chart shows the altcoin sitting below its 20, 50, 100, and 200-day EMAs all at once. That stack-up is a textbook sign of a bearish trend, and it has been the case for a while now.
This makes the $XRP moving averages a key part of the current setup. The RSI near 36 also suggests that momentumremains weak, although the market is approaching levels where short-term reliefrallies can occur.
Traders should therefore watch whether RSI turns higheralongside a recovery above the key EMAs rather than relying on either indicatoralone.
There is one bright spot, though. The RSI sits near 36, not deep oversold territory yet, but getting close. Readings around this level have a habit of producing short relief bounces before the bigger trend reasserts itself.
$XRP also broke below a short-term consolidation zone recently. For now, that break still favors sellers.
$XRP Key Support Levels and Resistance to Watch
On the short-term chart, two upside targets stand out.
Traders following XRP support and resistance levels should also monitor the $1.09 and $1.05 downside zones against the $1.1938 and$1.26 resistance targets.
Asustained break above resistance could improve the bullish setup, while losingsupport would weaken the recovery case.
The first is $1.1938, marked as the first major resistance.
The second is $1.2600, seen as the next key target if momentum builds.
On the downside, $1.0900 is the main support to watch. Below that sits $1.0500, viewed as a deeper invalidation zone.
If the altcoin loses the $1.1340 to $1.1408 zone, a drop back toward $1.0900 becomes more likely.
Could $XRP fall toward $1.12 or lower
Some analysts point to $1.12 as a major support area, tied to the 1.0 Fibonacci level on longer time frames.
These $XRP Fibonacci levels should be treated as technical referencepoints rather than guaranteed reversal zones.
Asustained loss of $1.12 would weaken the short-term recovery structure andcould bring lower support areas into focus.
If Ripple cannot reclaim higher resistance zones, the broader decline could continue toward this region.
A recovery back above key resistance would be needed to shift the picture. Until then, the path of least resistance still seems to favor downside pressure.
$XRP ETF Flows Add Another Market Signal
Spot XRP ETF net flows are another factor traders are monitoring along side technical indicators.
Recent weekly inflows or outflows should be added here using the latest SoSoValue data.
Persistent net inflows could support the bullish case by signalling stronger institutional demand, while sustained outflows would add pressure to the bearish scenario.
What does the long-term Elliott Wave count suggest for $XRP
Zooming out, some chartists view XRP's history through EW theory. The pattern shows a large Wave I top, followed by a long Wave II correction.
After that came a strong Wave III impulsive move, then a Wave IV pullback.
The current structure may now be building toward a Wave V, the final impulsive leg in this long-term count. Wave 5 moves are often compared to 1.236 to 1.618 times the size of Wave 4, though this is just one way to read the chart.
This kind of long-range mapping is meant for context, not for short-term trading decisions.
Trading volume will also be important. A bullish breakout supported by rising trading volume would carry more weight than a move higher ondeclining participation.
$XRP key support level to watch this week
The $1.15 level matters a lot rightnow. This makes$1.15 one of the most important $XRP key support levels for the current week.
Holding above it could keep the short-term recoverystructure alive, while a sustained break below it would increase theprobability of a move toward $1.09 and potentially $1.00.
If XRP can hold above this zone, it may build momentum toward $1.20 and then $1.25.
Losing $1.15, though, could open the door back toward the $1.00 mark.
For now, traders seem to be watching this tight range closely, waiting for a clearer signal in either direction.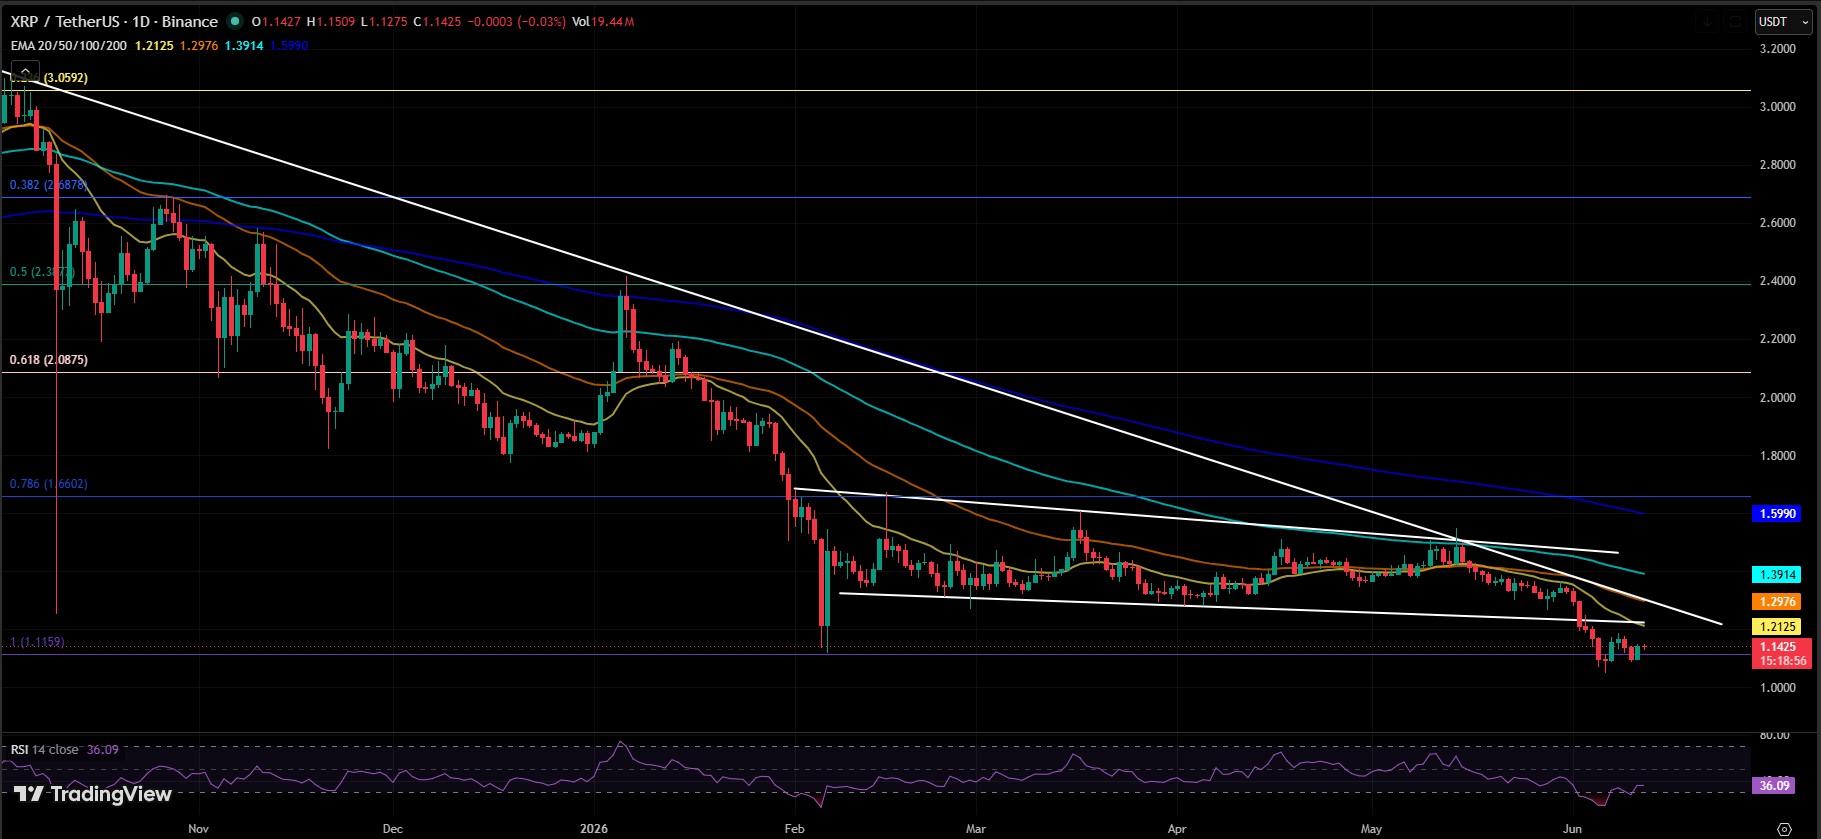
At press time, XRP was trading at $1.1436, holding just above its short-term moving average on the lower time frames.
$XRP Price Forecast: Bull, Base and Bear Scenarios
| Scenario | Target Range | Probability | Invalidation |
|---|---|---|---|
| Bear | $0.90–$1.05 | 30% | Sustained recovery above $1.26 |
| Base | $1.09–$1.26 | 45% | Weekly close below $1.09 |
| Bull | $1.40–$1.80 | 25% | Failure to reclaim $1.1938 and $1.26 |
Note: These are scenario-based estimates derived from the current chart structure andare not guaranteed price targets.
How the XRP Price Forecast Model Works
This $XRP price forecast weighs the current support and resistance structure, RSI momentum, 20-, 50-, 100-, and 200-day EMA positioning, Fibonacci levels, and trading volume.
MVRV can be added as a secondary valuation indicator when reliable current data is available.
The bullish case requires a sustained reclaim of resistance with stronger volume, while the bearish case becomes more likely if XRP loses major support with continued weak momentum.
XRP Price Target:How Analyst Forecasts Compare
Analyst expectations vary widely depending on the time horizon. Standard Chartered has previously cited an XRP target around $2.80, while EGRAG CRYPTO has discussed a much more bullish $7–$10 cycle view.
These targets represent different assumptions and timeframes and should not beinterpreted as short-term forecasts for the current price structure.
Disclaimer
This article is for informational purposes only and does not constitute financial advice. Cryptocurrency markets are highly volatile and unpredictable. Always conduct your own research and consult a licensed financial advisor before making any investment decisions. Past performance does not guarantee future results.