XRP MVRV Ratio Hits 5-Year Low: Is a Major Rally Next?


Updated: July 24, 2026
Change Note: This update expands the XRP MVRV ratio analysis with a beginner-friendly MVRV explanation, historical bottom comparison, technical indicators, ETF-flow context, analyst targets, bull/base/bear scenarios, and key support and resistance levels.
Refresh Cadence: Weekly during major XRP market developments; monthly for evergreen on-chain and technical analysis.
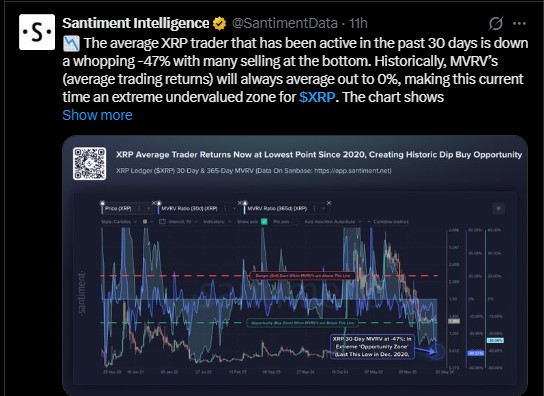
The XRP MVRV ratio has crashed to a level not seen since December 2020, while $XRP is trading near $1.34 after falling more than 26% since January. That combination is drawing attention from traders who see extreme on-chain losses as a potential contrarian signal.
According to the data discussed in this analysis, the average trader who bought $XRP during the last 30 days is sitting on an unrealized loss of nearly 47%. Historically, deeply negative MVRV readings can appear when short-term holders capitulate and selling pressure becomes exhausted.
That does not guarantee a rally. But it raises an important question: Is $XRP entering another accumulation phase, or does the market still have further downside before a recovery?
What Is the $XRP-MVRV Ratio and Why Does It Matter?
MVRV stands for Market Value to Realized Value. In simple terms, it compares the current market value of an asset with the estimated value at which coins last moved on-chain.
When MVRV is high, holders are generally sitting on larger unrealized profits. That can increase the risk of profit-taking.
As per Sentiment, when MVRV falls deeply into negative territory, holders are increasingly underwater. Historically, extreme negative readings can signal periods of capitulation, when weaker holders sell and longer-term investors begin accumulating.
The current MVRV ratio is particularly notable because the 30-day reading has reportedly fallen to its lowest level since December 2020.
However, MVRV should not be treated as a standalone buy signal. A complete forecast should combine MVRV with RSI, EMA trends, trading volume, whale activity, and ETF flows.
$XRP MVRV-Ratio History: What Happened at Previous Bottoms?
The current reading becomes more interesting when viewed against its historical market cycles.
The source analysis highlights several periods when XRP/BTC entered an extreme structural zone:
-
2014: XRP/BTC entered a deep bear-market range before beginning a multi-year recovery.
-
2016: It returned to a similar macro zone before the 2017 crypto bull market.
-
2020: Another extreme setup appeared before the 2021 rally.
-
2025–2026: The current structure is developing around a comparable long-term zone.
Three previous formations were followed by significant recoveries, but the current fourth formation is still developing.
This is why the MVRV signal is best viewed as a historical comparison rather than a prediction. Previous bottoms do not guarantee that the current market will follow the same path.
$XRP/BTC Monthly Chart: What Does the YOLO Band Setup Show?
The $XRP/BTC monthly chart adds another layer to the analysis.
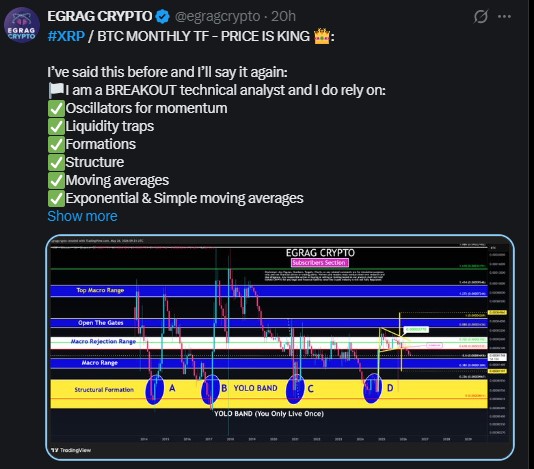
According to the chart interpretation from EGRAG Crypto, XRP/BTC has broken down from a major macro formation. Two Fibonacci levels now represent potential downside targets:
-
0.5 Fibonacci: 0.00001615
-
0.382 Fibonacci: 0.00001284
For bulls to regain structural control, the chart needs to reclaim higher Fibonacci levels:
-
0.618 Fibonacci: approximately 0.000021
-
0.702 Fibonacci: approximately 0.000024
Until these levels are reclaimed and sustained on a monthly basis, the XRP/BTC structure remains technically weak.
The chart also identifies what analysts call the YOLO Band, a deep macro zone that has historically appeared around extreme market lows.
The key takeaway is that its on-chain data looks potentially bullish from a contrarian perspective, while the XRP/BTC structure remains bearish until confirmation.
The YOLO Band Has Appeared Three Times Before
The XRP/BTC monthly chart from 2013 to today shows a deep structural zone near the 0.236 Fibonacci level that analysts have labeled the YOLO Band. It marks the absolute floor of the macro range, a place where price only visits during the most extreme points of a cycle.
That zone has produced four significant formations across its entire history:
-
Formation A (2014): XRP/BTC collapsed into this zone during the first major bear cycle. What followed was a multi-year recovery.
-
Formation B (2016): Price returned to the YOLO Band before the 2017 bull run that took it from fractions of a cent to over $3.
-
Formation C (2020): The same zone appeared again before the 2021 rally that pushed it nearly to $2.
-
Formation D (2025–2026): XRP/BTC is currently inside this zone, building what looks like the fourth major structural base.
Three out of three prior formations in this zone led to significant recoveries. The D formation is still developing. The base is still being built. But the setup is identical to what came before it.
$XRP Technical Model: What Indicators Should Traders Watch?
The model used in this analysis combines five major indicators:
-
MVRV: Extreme negative readings can indicate capitulation and potential long-term value zones.
-
RSI: A deeply oversold RSI reading can signal that selling momentum is stretched, although oversold markets can remain weak for extended periods.
-
Moving averages: moving averages help determine whether the broader trend is recovering. Reclaiming major EMAs with volume would provide stronger confirmation.
-
Trading volume: A bullish breakout supported by rising trading volume is more credible than a low-volume price spike.
-
ETF flows: ETF inflows provide a direct measure of institutional demand and should be monitored alongside on-chain data.
This combination creates a more balanced analysis today. The MVRV signal is potentially bullish, but the technical structure needs confirmation.
$XRP ETF Flows: Is Institutional Demand Still Supporting the Market?
$XRP-linked ETF flows have become an increasingly important part of the price narrative.
The source analysis notes that ETF inflows have remained surprisingly steady despite the broader price decline. This suggests that some institutional investors may be viewing weakness as an opportunity to build exposure.
However, ETF flows can change quickly. Strong net inflows combined with rising spot volume would strengthen the bullish thesis. Sustained outflows would weaken it.
For traders watching $XRP price prediction today and price prediction this week, ETF flows may therefore be more important than a single daily candle.
$XRP Price Target: Bull, Base and Bear Scenarios
The following scenarios combine the current MVRV ratio, technical structure, ETF demand, RSI, moving averages, volume, and broader market conditions.
| Scenario | Target | Probability | Key Assumption | Invalidation |
| Bull case | $7–$10 | 25% | Strong XRP ETF inflows, Bitcoin strength, structural recovery and renewed altcoin demand | Continued macro breakdown and failure to reclaim key resistance |
| Base case | $2.80–$5.60 | 50% | Gradual institutional adoption and improving market liquidity | Persistent ETF outflows and weak trading volume |
| Bear case | $0.80–$1.50 | 25% | XRP/BTC breakdown continues and broader crypto market weakens | Strong monthly reclaim of major Fibonacci resistance |
These are analytical scenarios rather than guaranteed targets.
Standard Chartered has previously cited a 2026 $XRP target around $2.80, representing a more conservative institutional outlook. At the bullish end, EGRAG Crypto has discussed cycle projections in the $7–$10 range. These forecasts differ significantly, highlighting the uncertainty surrounding any long-term XRP price target.
The gap between institutional and technical-cycle forecasts is precisely why investors should focus on invalidation levels rather than relying on one prediction.
$XRP Support and Resistance Levels to Watch
For readers researching XRP support and resistance levels, the most important zones are determined by the current macro structure and Fibonacci positioning.
On the downside, the market needs to hold the current accumulation zone. A sustained breakdown could push $XRP toward deeper historical support before a meaningful recovery begins.
On the upside, the XRP/BTC chart must first reclaim the 0.618 Fibonacci level near 0.000021. A move above 0.702 near 0.000024 would provide stronger evidence that the macro breakdown has been reversed.
On the XRP/USD chart, traders should also monitor major moving averages and previous swing highs. A successful breakout should ideally occur with improving RSI and increasing trading volume.
This combination would provide stronger confirmation than price alone.
Can $XRP Go Up After the MVRV Collapse?
The historical evidence suggests that extreme MVRV readings can appear near periods of market capitulation.
The current setup has several potential bullish catalysts:
-
MVRV ratio at December 2020 levels.
-
Short-term holders carrying significant unrealized losses.
-
Potential ETF demand despite weak spot performance.
-
Ripple's continued expansion in tokenization and cross-border payment infrastructure.
-
The possibility of Bitcoin-driven capital rotation into large-cap altcoins.
However, the bearish risks remain substantial.
The XRP/BTC monthly structure is still damaged, and the 0.618 and 0.702 Fibonacci levels have not yet been decisively reclaimed. If Bitcoin enters another major correction, it could fall regardless of its MVRV reading.
This is why the answer to will it go up tomorrow cannot be determined by MVRV alone.
Is $XRP Bullish or Bearish Right Now?
The answer depends on the timeframe.
Short term: The picture remains mixed to bearish because the XRP/BTC structure has broken down and confirmation levels remain above the current market.
Medium term: The deeply negative MVRV ratio creates a potential contrarian setup. If ETF inflows continue and trading volume improves, the probability of a recovery increases.
Long term: The bullish case depends on whether it can repeat the historical pattern of extreme MVRV lows followed by renewed demand and broader crypto-market expansion.
For anyone asking is XRP a good buy right now, the most important consideration is risk management. Extreme MVRV conditions may offer attractive long-term valuations, but they do not eliminate the possibility of further downside.
Final XRP Price Prediction 2026
The current XRP MVRV ratio is one of the most notable contrarian signals in the market. A reading near December 2020 levels, combined with heavy losses among recent buyers, suggests that significant capitulation may already have occurred.
But the market has not yet confirmed a bottom.
The XRP/BTC monthly chart remains structurally weak until key Fibonacci levels are reclaimed. At the same time, steady ETF demand, potential institutional accumulation, and Ripple's broader ecosystem expansion could provide catalysts for a future recovery.
For a broader outlook, readers can review XRP price prediction 2026 for the wider annual forecast and monitor support and resistance levels for updated technical zones.
The most important signal to watch next is confirmation: improving MVRV, stronger RSI, rising volume, sustained ETF inflows, and a reclaim of major Fibonacci resistance.
If those signals align, the current extreme MVRV reading could prove to be an important accumulation indicator. If they do not, the market may need more time to build a durable bottom.
The data is showing an opportunity—but the charts still need to prove it.
Disclaimer: This article is for informational purposes only and does not constitute financial, investment, or trading advice. Cryptocurrency markets are highly volatile and involve significant risk, including the potential loss of capital. Historical patterns do not guarantee future performance. Always conduct your own research and consult a qualified financial adviser before making investment decisions.

















