Shiba Inu Price Prediction: SHIB Update! Can 10M Burn Boost Price?

Can SHIB hit 500x this cycle? One trader on X says it can, and a number like that can make people fear missing the next run. Big calls are easy to post and hard to back up.
Alongside it, a fresh burn of 10 million SHIB is in the news, and the chart sits near a key level. This Shiba Inu price prediction covers the 500x claim, the latest burn data, and the levels on the chart.
Market data checked on October 10, 2026
Shiba Inu Price Prediction Today: Market Overview
| Metric | Value |
|---|---|
| $0.000005472 | |
| Change (current 1D candle) | +1.70% (+$0.000000009) |
| Market Cap | $3,240,334,817 |
| 24h Volume | $69,186,439 |
| Market Cap Rank | #36 |
| Circulating Supply | 585,482,272,731,600 |
| Total Supply | 589,155,131,429,539 |
Market cap, volume, rank and supply come from Shibburn's hourly update. That update lists the price at $0.000005472 (+1.70% over 24 hours), which differs slightly from the OKX chart because the two sources use different data and timing.
SHIB News: Trader Posts 500x Target for $SHIB
A post on X says a meme coin supercycle will send $SHIB up 500x. A supercycle means a long and strong market rise.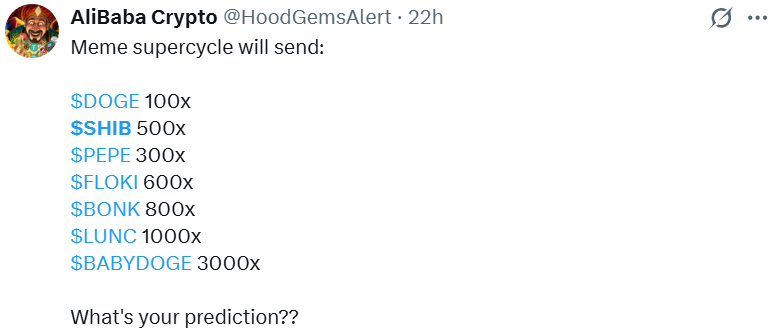
Source: Data From X
The same post lists DOGE at 100x, PEPE at 300x, FLOKI at 600x, BONK at 800x, LUNC at 1000x and BABYDOGE at 3000x, then asks readers for their own predictions.
These targets are one trader's opinion, not a forecast built on data. CoinGabbar could not independently verify any of them, and nothing on the SHIB chart currently points to a move of that size.
Shiba Inu News Today: SHIB Burn Tracker Shows 10 Million Tokens Burned
A post by Shibburn on X says 10,000,000 $SHIB were burned in the past hour in one transaction. A burn sends tokens to an address nobody can use, which removes them from circulation.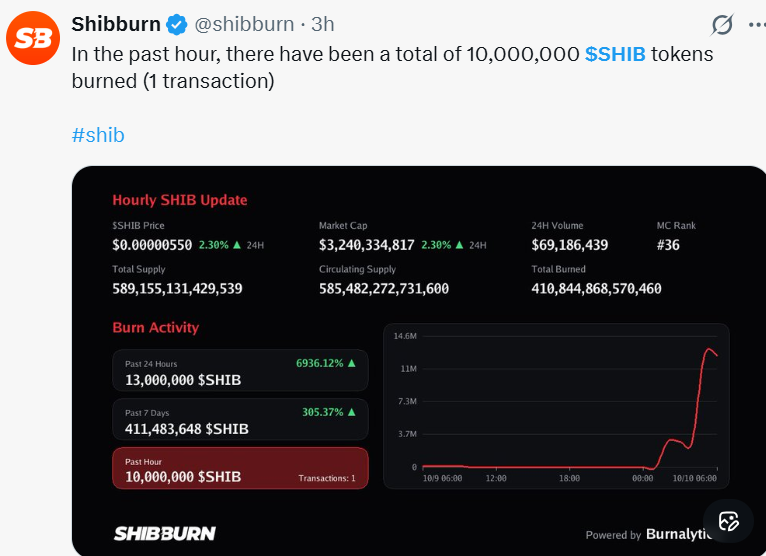
The tracker also lists 13,000,000 $SHIB burned over 24 hours, up 6936.12%, and 411,483,648 SHIB over seven days, up 305.37%.
Size matters here. Ten million tokens is about 0.0000017% of circulating supply and worth about $55 at the tracker price.
A percentage jump looks large when the starting number is small. These figures come from Shibburn's tracker, and CoinGabbar did not check them on-chain.
$SHIB Price Chart: Technical Analysis
$SHIB fell from May into June, then began moving inside a rising channel. A channel is a pair of sloping lines that price moves between.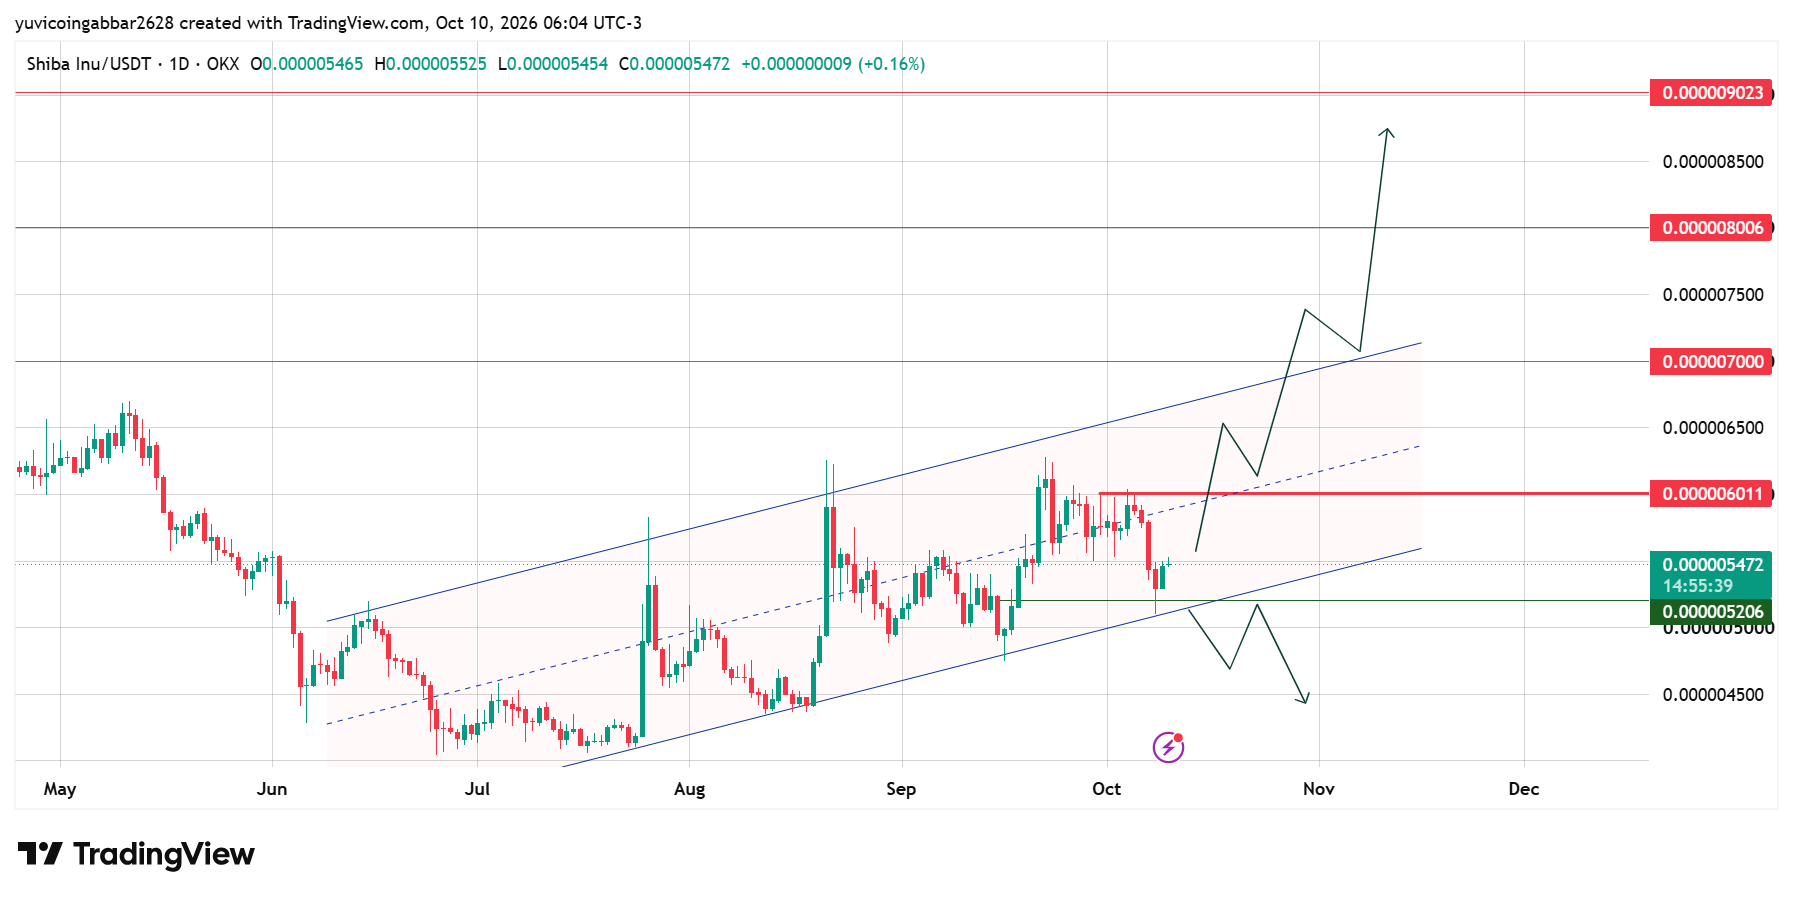
Price rose toward the upper line in late August and again in late September, then pulled back in early October. The early-October low dipped just under $0.000005206 near the lower channel line support, and the price has bounced since.
The paths drawn on the chart show one move up toward $0.000009023 and one move down below the channel.
SHIB Support Levels: Where the Bounce Could Hold
$0.000005206 is the first support, meaning an area where buyers have stepped in before. No marked level sits below it. The bearish path on the chart ends near the $0.000004500 axis level, outside the channel.
SHIB Resistance Levels: Targets in This $SHIB Forecast
$0.000006011 is the nearest resistance, meaning an area where sellers have pushed prices down before. It sits near the highs of early October. Above that, the chart marks $0.000007000, $0.000008006, then $0.000009023.
Shiba Inu Forecast: Triggers and Invalidation
| Scenario | Trigger | Likely Outcome | Invalidation |
| Channel hold | Daily closes stay above $0.000005206 | Move toward $0.000006011 | Close below $0.000005206 |
| Resistance break | Close above $0.000006011 | Push toward $0.000007000 | Close back below $0.000006011 |
| Channel breakdown | Close below $0.000005206 | Slide toward $0.000004500 | Reclaim $0.000005206 |
Shiba Inu Price Prediction: Can $SHIB Reach $0.000009023?
SHIB would need to pass $0.000006011, $0.000007000 and $0.000008006 first. A move to $0.000009023 from $0.000005472 is a gain of about 65%.
A 500x move would put SHIB near $0.002736, far above every level on the chart. The chart does not point to that move, and price is still below the channel's middle line.
Shiba Inu Price Prediction 2026: Expert View
According to CoinGabbar analysts , $SHIB is bouncing near the lower channel line, but the move is small so far. The 10 million token burn is tiny next to the supply, so the chart matters more than the burn. A daily close above $0.000006011 would be the first sign of momentum.
Disclaimer
This article is for informational purposes only and is not financial advice. Crypto markets are volatile. Do your own research before making any trading decisions involving $SHIB.

















