Shiba Inu Price Prediction: 4.5M SHIB Burned in 24 Hours! What’s Next?

SHIB's burn rate reportedly jumped 2,349%. Does that help the price? Not much so far. One post says the value burned was only around $5, and the daily chart shows the price sliding under a rising trendline it held since July.
This Shiba Inu price prediction checks the burn claims against the chart, then lists the levels to watch.
Market data checked on October 26, 2026, at 12:33 IST.
Shiba Inu Price Prediction Today: Market Overview
Metric | Value |
Price (TradingView OKX daily chart) | $0.000004825 |
Daily Candle Change | -1% |
Candle Open | $0.000004844 |
Candle Range | $0.000004789 – $0.000004867 |
Why is SHIB’s price down today?
The Shiba Inu price today is down 1% to $0.000004825 in 24 hours, slightly underperforming a flat Bitcoin, primarily driven by a risk-off rotation away from meme coins amid broader market caution.
Primary reason: Sector-wide pressure on meme coins, with the Altcoin Season Index falling 1.92% as capital shifts toward Bitcoin ahead of key macro events.
Secondary reasons: Beta-driven drag from Bitcoin’s dip and weak technical structure, with price below key moving averages and RSI at 35.14 showing weak momentum.
Shiba Inu News Today: 4.55M $SHIB Burned in 24 Hours
Shibburn posted that 4,549,014 $SHIB were burned in the past 24 hours. A burn sends tokens to a wallet that nobody can spend from, which cuts supply.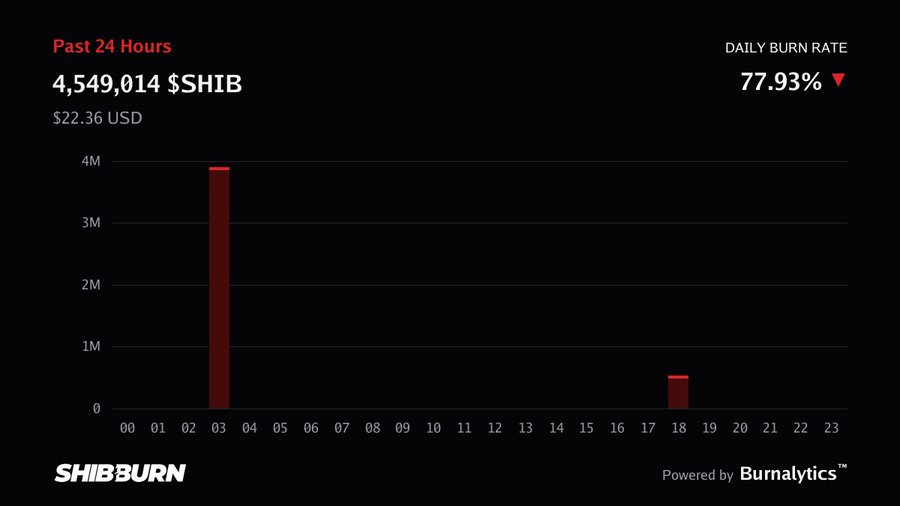
At the chart price, that amount is worth about $22. Burns only matter for price if they are large against supply and demand stays steady.
SHIB Price Outlook: Burn Value and Shibarium Concerns
SHIBMortal posted that the burn rate reportedly surged 2,349%, but the value burned was only around $5. The post adds that Shibarium, the Shiba Inu network built on Ethereum, has shown signs of weakness.
Source: Data From X
It gives no source or data for either point, so CoinGabbar could not verify them. A big percentage jump from a tiny starting number can still be tiny in dollars.
Shiba Inu Price Prediction: $SHIB Breaks Its July Trendline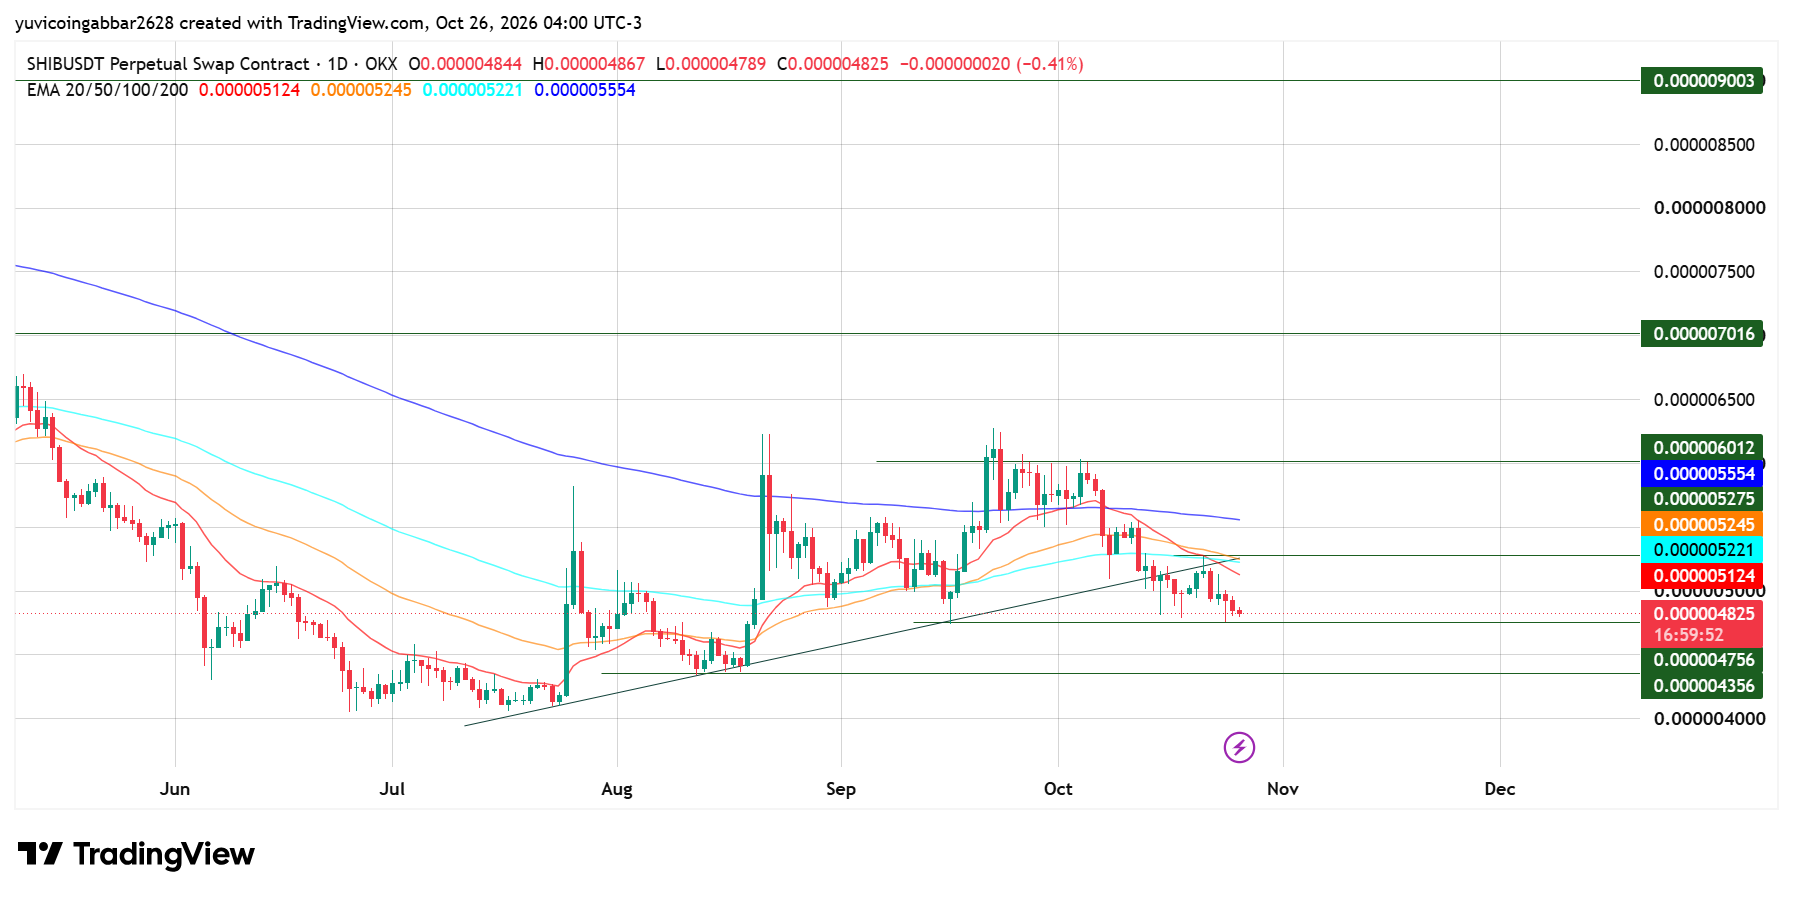
$SHIB climbed along a rising trendline from July, then fell below it in October and has kept sliding.
Today's candle opened at $0.000004844, ranged from $0.000004789 to $0.000004867 and printed $0.000004825, about 1.4% above a marked support line at $0.000004756.
An EMA, The 20, 50, 100 & 200 EMAs are bunched between $0.000005124 and $0.000005245, with the 20 EMA turning down. All four sit above price. That cluster is the first big hurdle for any bounce.
EMA | Value | Position vs Price |
EMA 20 (red) | $0.000005124 | Above price |
EMA 50 (orange) | $0.000005245 | Above price |
EMA 100 (cyan) | $0.000005221 | Above price |
EMA 200 (blue) | $0.000005554 | Above price |
Shiba Inu Forecast: Support and Resistance Levels
Type | Level |
Highest marked level | $0.000009003 |
Resistance 3 | $0.000007016 |
Resistance 2 | $0.000006012 |
Resistance 1 | $0.000005275 |
Immediate support | $0.000004756 |
Deeper support | $0.000004356 |
Bull case: A daily close above the EMA 20 at $0.000005124 would be a start. Reclaiming $0.000005275 and the broken trendline would put the EMA 200 at $0.000005554 in view.
Bear case: If SHIB closes below $0.000004756, the price could slide about 10% toward $0.000004356.
SHIB Scenarios and Invalidation (October 26, 2026)
Scenario | Trigger | Likely Outcome | Invalidation |
Bull | Close above $0.000005275 | Move toward $0.000005554, then $0.000006012 | Close below $0.000004756 |
Base | Range of $0.000004756 to $0.000005124 | Sideways under the EMA cluster | Break of either level |
Bear | Close below $0.000004756 | Slide toward $0.000004356 | Close back above $0.000004756 |
Shiba Inu Price Prediction: Can Shiba Inu Reach $0.000006012?
It would take a gain of about 25% from $0.000004825. Any SHIB price prediction toward that level needs more than burn headlines, since $SHIB must clear the EMA cluster, $0.000005275 and the EMA 200 first.
The top marked level at $0.000009003 would mean a gain of about 87%.
Shiba Inu Price Prediction 2026: Expert View
Price sits under all four EMAs and just above $0.000004756, so the setup stays cautious until SHIB closes above $0.000005124.
Disclaimer
This article is for informational purposes only and isn't financial advice. Crypto markets are volatile. Always do your own research before making any trading decisions involving SHIB.

















