Shiba Inu Price Prediction November 2026: Can SHIB Rebound?


Is $0.000004907 the bottom, or just another step down?
SHIB slipped 3.07% in 24 hours while trading volume jumped 62.66% to $74.29M. Busy tape, weaker price.
That mix shapes any Shiba Inu price prediction November 2026 call, and a recent SHIB channel analysis already flagged the pressure.
SHIB Market Snapshot on October 24, 2026
Figures below come from CoinMarketCap market data at 10:50 UTC on October 24, 2026.
Price: $0.000004907, down 3.07% (rank 33)
Market cap: $2.89B, down 3.06%
24h trading volume: $74.29M, up 62.66%
Volume to market cap: 2.6%
Circulating supply: 589.23T SHIB
24h range: $0.000004873 to $0.000005120
All-time high: $0.00008845, now 94.47% below
A 2.6% volume ratio is modest for a top-40 asset. Rising volume on a falling price usually points to sellers, though dip buyers can hide inside it.
And liquidity depth, at 0.17% of market cap, is thin enough to exaggerate moves.
Why Is Shiba Inu Price Falling Today?
$SHIB is sliding. CoinMarketCap shows a 3.07% drop over 24 hours. Market cap followed, down 3.06%. Sellers own the tape.
Bitcoin fell only 1.25% in the same window. SHIB fell harder. So weak demand and a drifting market explain most of it. A channel breakdown risk was flagged earlier too.
Shiba Inu Technical Analysis: What Does the $SHIB Chart Show?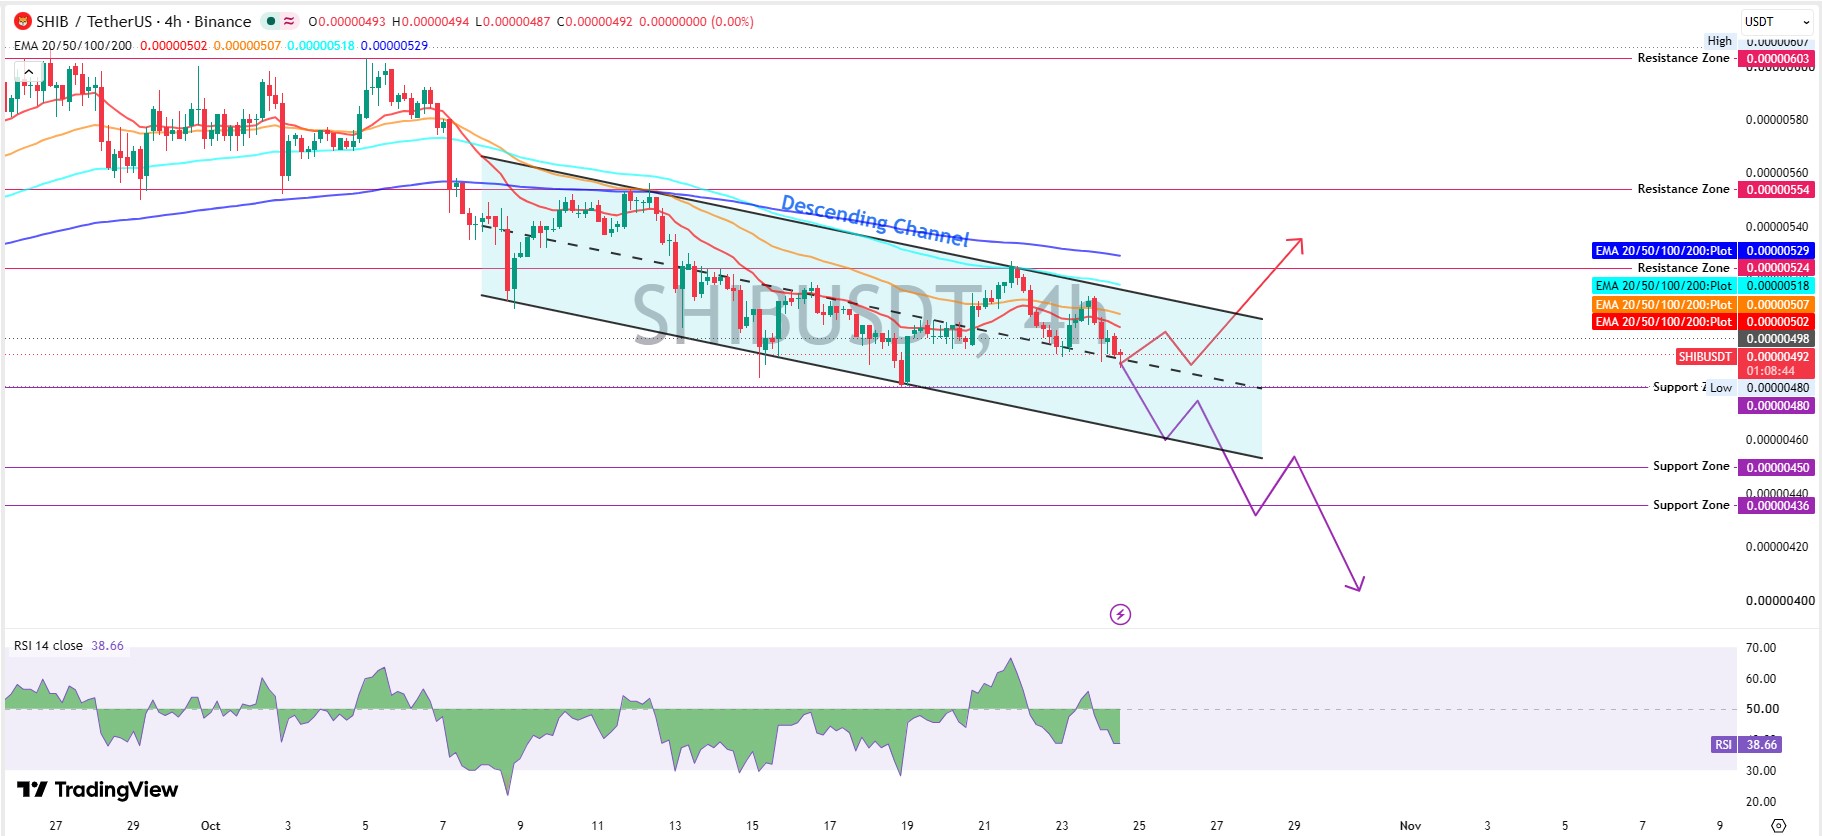
Descending Channel and Moving Averages
On the 4-hour TradingView chart, $SHIB trades inside a descending channel, with two falling lines that box the price in.
Price sits at $0.00000492, below every key average. The 20 EMA reads $0.00000502.
And the 50 EMA, 100 EMA, and 200 EMA stack higher at $0.00000507, $0.00000518, and $0.00000529.
RSI reads 38.66. Below 50 favors sellers, and below 30 flags oversold.
But 38.66 isn't oversold. More downside room remains. Bears hold the edge for one reason. Lower highs.
Shiba Inu Support and Resistance Levels to Watch
Resistance stacks at $0.00000524, $0.00000554, and $0.00000603. Earlier coverage of an EMA resistance rebound shows why the first zone matters.
Support sits at $0.00000480, $0.00000450, and $0.00000436.
And if $0.00000480 fails. Then $0.00000450 becomes the target.
So which side blinks first?
Nobody knows yet, but the lower channel line sits close.
$SHIB Trading Volume Analysis and Derivatives Data
Coinglass derivatives data lists futures volume at $41.41M, spot volume at $18.43M, and open interest at $49.21M.
Liquidations over 24 hours total $143.81K, and longs took $135.93K of it. That's one-sided pain.
OKX shows a long/short ratio of 2.96, so longs outnumber shorts nearly three to one. Crowded longs on a falling chart feed more selling.
Rising volume reads as early buying, or maybe not, since longs absorbed nearly all the liquidations.
Shiba Inu Price Prediction for November 2026
$SHIB Scenario Table
This Shiba Inu price prediction November 2026 splits into three paths, much like the September SHIB prediction. Each SHIB bullish and bearish price prediction path carries a trigger and an exit.
Scenario | Trigger | Target | Invalidation | Liquidity condition |
Bullish | Trades above $0.00000524 on rising volume | $0.00000554 to $0.000006 | Falls below $0.00000502 | Volume above $74.29M, shorts squeezed |
Base | Holds $0.00000480 to $0.00000524 | $0.00000490 to $0.00000520 | Breaks either edge on heavy volume | Volume near 2.6% of market cap |
Bearish | Breaks below $0.00000480 | $0.00000450, then $0.00000436 | Reclaims $0.00000502 | Longs liquidated, thin bids |
Can $SHIB Reach $0.000006 in November 2026?
Reaching $0.000006 needs a 22.3% gain from $0.000004907. That means clearing three resistance zones.
Possible, but not the base case. Past coverage of an explosive SHIB chart move shows rallies can arrive fast.
The first Shiba Inu price target for November 2026 is $0.00000554, a 12.9% gain.
Will $SHIB Break Resistance in November?
Buyers need one thing. A push through $0.00000524 on rising volume.
Anything less is a bounce inside the channel. A Shiba Inu price prediction after market decline usually needs proof, and proof is missing.
Bearish drift is likelier. Downside targets of $0.00000450 and $0.00000436 mean 8.3% and 11.2% drops.
$SHIB Holder and Supply Data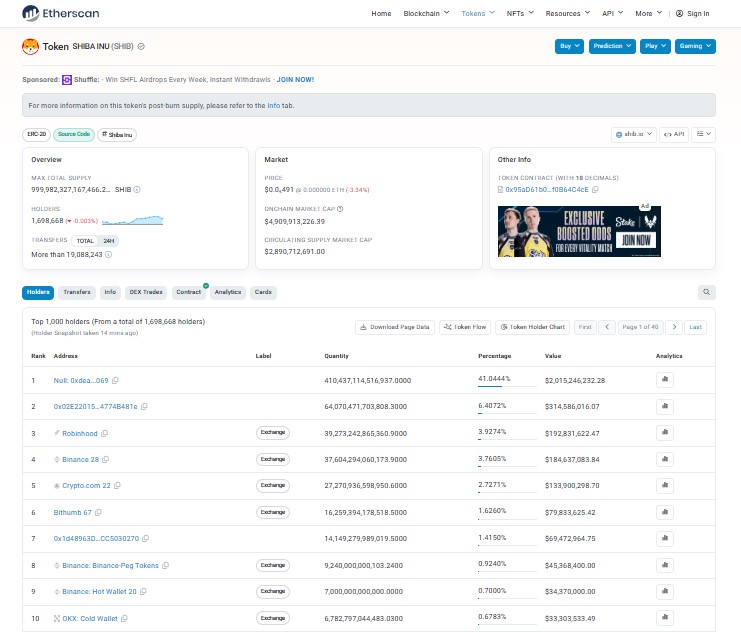
Etherscan token data shows 1,698,668 holders, while CoinMarketCap reports 3.1M. Different counting methods likely explain the gap.
The top holder is the burn address, with 410.4T SHIB. That's 41.04% of max supply, worth about $2.02B.
Can $SHIB Burns Support a Recovery?
Burning removes tokens from circulation for good. But fewer tokens only help when demand holds steady.
Coverage of a SHIB burn rate spike adds context. Circulating supply still sits at 589.23T, and price slid anyway.
Bitcoin Influence on the Shiba Inu Market Outlook
Bitcoin trades at $80,555.08, down 1.25%, with a $1.61T market cap and $21.99B in volume, down 13.87%.
The broader Shiba Inu market outlook leans on that backdrop. A quiet Bitcoin gives $SHIB no tailwind.
Will Shiba Inu Recover in November 2026?
Not yet. Short-term bias stays bearish.
Recovery needs a trade above $0.00000524 and an RSI back over 50. And buyers need volume that sticks.
Until then, bounces toward $0.00000502 are likelier to stall than extend. Earlier SHIB holder rally coverage shows sentiment can turn fast, but price has to confirm it. Levels to watch: $0.00000480 below, $0.00000524 above.
Disclaimer: This article is for information only and isn't financial advice. Crypto prices swing fast, and trading carries risk. Independent research matters before any decision.

















