Shiba Inu Price Prediction: Can Rakuten News Lift SHIB?


Free coins for Japanese holders, so why is SHIB still sliding?
That's the puzzle behind today's Shiba Inu price prediction, and the answer isn't comforting. Shiba Inu price today is $0.000005053, down 1.82% as of 09:35 UTC on October 17, 2026.
Rakuten's gesture follows the Japan listing milestone, yet the chart still tilts weak.
Shiba Inu Price Today: Market Snapshot
Numbers first. These figures come from CoinMarketCap data at 09:35 UTC, where SHIB ranks 32.
Metric | Value |
Price | $0.000005053 |
24H change | -1.82% |
24H range | $0.00000503 to $0.000005178 |
Market cap | $2.97B |
24H volume | $41.37M (-23.46%) |
Circulating supply | 589.23T SHIB |
Volume fell 23.46% while price slipped. And that equals just 1.38% of market cap, so interest stays thin.
Shiba Inu Performance by Timeframe
Period | Change |
7D | -7.41% |
30D | +1.43% |
90D | +22.06% |
Year to date | -26.75% |
1 year | -49.38% |
Short-term pain, medium-term gain. A 22.06% rise over 90 days hasn't vanished. But a 49.38% yearly slide shows how deep the hole runs.
Yesterday's Prediction: Target vs. Actual Result
Yesterday's rebound forecast used data stamped 07:30 UTC on October 16, 2026. Results run through 09:35 UTC on October 17, 2026.
Level | Target | Actual |
Bull trigger | Hold $0.00000512, break $0.00000529. | 24H high $0.000005178, $0.00000529 untouched |
Base range | $0.00000512 to $0.00000529 | Price slipped under the range |
Bear trigger | Lose $0.00000512 for $0.00000491 | $0.00000512 lost, $0.00000491 untouched |
Status: Partially Hit. Bears got the first trigger. But neither side reached a second target.
Shiba Inu News Today: Rakuten Coin Giveaway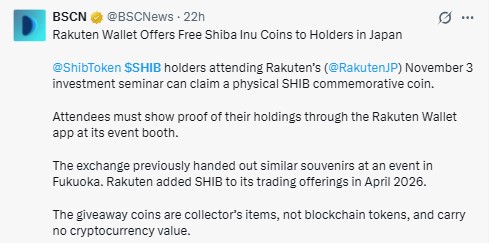
Shiba Inu news today is breaking from Japan. Rakuten Wallet will hand holders a physical SHIB commemorative coin. BSCN flagged it on X.
Date: November 3, 2026. Venue: Rakuten's investment seminar. Attendees must show holdings in the app. Rakuten added SHIB in April 2026, and Fukuoka attendees received similar souvenirs earlier.
But the coins are collector's items, not blockchain tokens, and carry no cryptocurrency value. Which is why price shrugged. Sector flows sit in meme coin news.
Why Is Shiba Inu Down Today?
Rakuten news isn't the reason Shiba Inu is down today, and it isn't the rescue either. The October 15 plunge came from a hot CPI selloff. Today's 1.82% slide is milder. Volume dropped 23.46%, so sellers aren't rushing. Buyers aren't showing up either.
Shiba Inu Futures Data
CoinGlass futures data shows who paid.
Metric | Value |
Futures volume (24H) | $26.98M |
Spot volume (24H) | $10.10M |
Open interest | $52.59M |
Long liquidations (24H) | $29.57K |
Short liquidations (24H) | $2.72K |
OKX long/short ratio | 2.69 |
Longs bled again. And OKX accounts still lean long, so crowded positions could unwind. Futures volume more than doubles spot volume.
Whale Concentration on Etherscan
Etherscan holder data counts 1,698,043 holders.
Metric | Value |
Whale wallets | 796 |
Whale share of market cap | 94.69% |
Top 5 holders | 57.94% |
Top 100 concentration | 82.82% |
Gini score | 0.9958 |
A Gini score near 1 means supply sits with very few wallets. Retail holds scraps. Whales set the tone.
Burn Wallet Share
One null address holds 41.0444% of supply, worth about $2.07B. That's the burn rate spike story, tokens parked where nobody can spend them.
Shiba Inu Price Prediction: Technical Analysis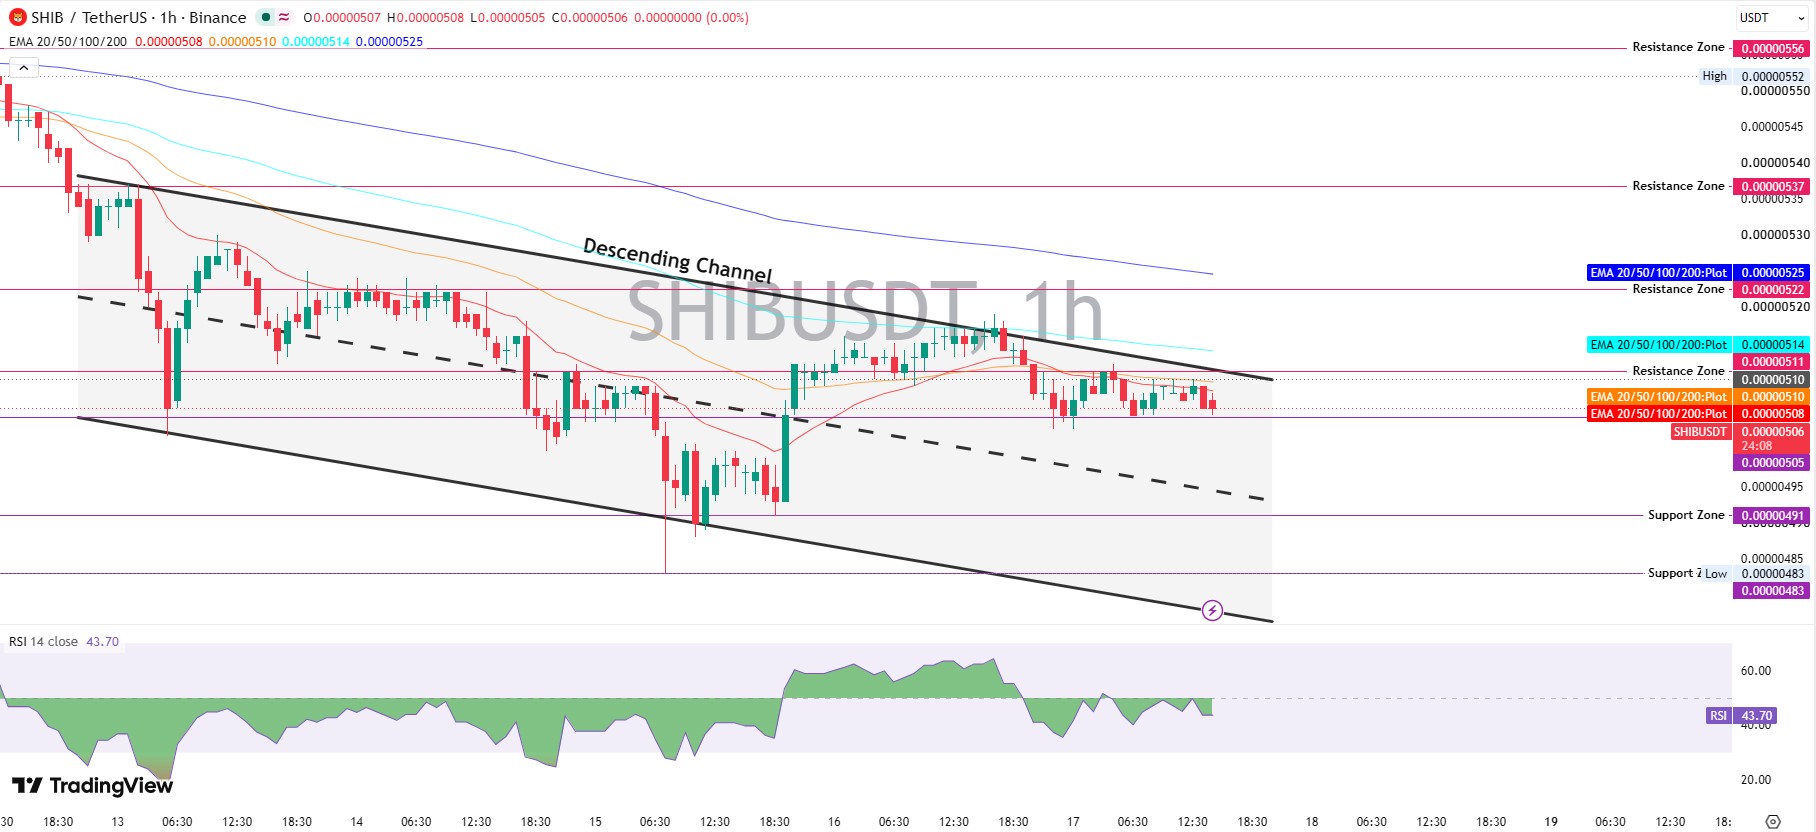
SHIB technical analysis on the TradingView 1-hour chart shows SHIB/USDT on Binance trading inside a descending channel, with two falling lines that box the price in. A price near $0.00000506 sits under the channel's upper edge around $0.00000511.
RSI reads 43.70. Below 50 favors sellers. But 30 is far away, so nothing's oversold.
An EMA is a moving average that weights recent trading more heavily. The 20 EMA, 50 EMA, 100 EMA, and 200 EMA sit at $0.00000508, $0.00000510, $0.00000514, and $0.00000525. Price trades under all four. Which means every bounce meets a ceiling.
So is a souvenir coin enough to flip that stack? EMAs rarely care about headlines.
Support Levels
Support is a floor where buyers stepped in before. $0.00000491 comes first, then $0.00000483, the low marked on the chart.
Resistance Levels
Resistance is a ceiling where sellers appeared before. $0.00000511 stands first, then $0.00000522, $0.00000537, and $0.00000556.
Shiba Inu Price Prediction: Bull, Base, and Bear Cases
This SHIB price prediction for the next 24 to 72 hours hinges on $0.00000511. Early September's falling wedge setup showed how quickly patterns flip.
Bull Case
Can SHIB reach $0.00000522? Only if trading holds above $0.00000514 with rising volume. A slide under $0.00000491 cancels it.
Base Case
Chop between $0.00000491 and $0.00000511 stays likely while volume stays thin.
Bear Case
Losing $0.00000491 could drag the price toward $0.00000483. Beneath that, no verified floor shows on the chart.
Bearish while price trades under $0.00000511. That sounds blunt, though cautious might be fairer, since the floor hasn't broken.
Shiba Inu Price Forecast: Long-Term View
Price trades 94.28% below the $0.00008845 all-time high set on October 28, 2021.
Any Shiba Inu price target beyond $0.00000556 stays guesswork until the EMA stack gets reclaimed. This Shiba Inu price prediction treats it that way.
Risks That Could Change the Forecast
Three risks could rewrite this SHIB price forecast. Thin volume. Whale concentration at 94.69%. Crowded longs on OKX. And capital rotating into themes covered in AI crypto news could drain meme coin flows.
Final Takeaway
Bias stays bearish below $0.00000511. Price trades under four EMAs, the RSI reads 43.70, and the 7D sits at -7.41%.
Reclaiming $0.00000514 would soften that stance. More setups sit in the crypto price predictions hub.
Disclaimer: This article is for informational purposes only and isn't financial advice. Crypto markets are volatile, and prices can move sharply in either direction. Readers should research independently and consult a licensed advisor before making decisions.
















