Shiba Inu Price Prediction: Can SHIB Hold $0.00000512 Support?

Did SHIB just escape its channel trap, or is this a bounce with an expiry date?
A 3.81% rebound pushed the Shiba Inu price today to $0.000005147 by 07:30 UTC on October 16, 2026. That's a cleaner picture than yesterday.
This Shiba Inu price prediction builds on the September price forecast and tests whether buyers can keep control. Volume says maybe not.
Shiba Inu Price Today: Market Snapshot
Metric | Value |
Price | $0.000005147 |
24H change | +3.81% |
24H range | $0.000004928 to $0.000005157 |
Market cap | $3.03B |
24H volume | $54.08M (-36.35%) |
These figures come from CoinMarketCap data at 07:30 UTC, where SHIB ranks 32.
Price rose. Volume fell. And that mismatch matters, since exchanges handled $53.39M of the $54.08M total.
Shiba Inu Performance by Timeframe
Period | Change |
7D | -2.71% |
30D | +4.18% |
90D | +24.45% |
Year to date | -25.37% |
1 year | -50.11% |
The 90-day gain is real. But the yearly slide shows how deep the hole still is.
Yesterday's Prediction: Target vs. Actual Result
The channel breakdown forecast was published October 15, 2026, at 11:28 UTC. Results below cover that point through 07:30 UTC today.
Level | Target | Actual |
Bull trigger | Reclaim $0.00000500, then $0.00000539 to $0.00000556. | $0.00000500 reclaimed, 24H high only $0.000005157 |
Base range | $0.00000483 to $0.00000500 | The price broke above it. |
Bear trigger | Lose $0.00000483 for $0.00000475 | Floor held, 24H low $0.000004928 |
Status: Partially Hit. The reclaim worked, yet $0.00000539 never arrived, and rising volume never showed up.
Why Is Shiba Inu Up Today?
Shorts got hit. Price bounced off the channel floor near $0.00000491. Bitcoin added 0.98% to $81,992.87. SHIB moved almost four times faster. So the bounce reads technical, with sector flow tracked in meme coin news.
Shiba Inu Futures Data
CoinGlass futures data shows the pain flipping sides.
Metric | Value |
Futures volume (24H) | $31.18M |
Spot volume (24H) | $12.52M |
Open interest | $52.42M |
Short liquidations (24H) | $24.19K |
Long liquidations (24H) | $2.78K |
OKX long/short ratio | 2.86 |
Shorts paid this time, but only $24.19K worth. Which is pocket change. And OKX accounts still lean long at 2.86, so crowded longs could get flushed again.
Whale Concentration Check
Etherscan holder data counts 1,698,174 holders, yet control sits with very few.
Metric | Value |
Whale wallets | 799 |
Whale share of market cap | 94.69% |
Top 100 concentration | 82.83% |
Gini score | 0.9958 |
A Gini score near 1. That means almost all supply sits with very few wallets.
Burn Wallet Share
One null address holds 41.04% of SHIB, worth about $2.11B. That supply sits locked for good, a story told in the burn rate spike report.
Exchange wallets matter more for price. Robinhood holds 3.93%, and Binance 28 holds 3.76%.
Shiba Inu Price Prediction: Technical Analysis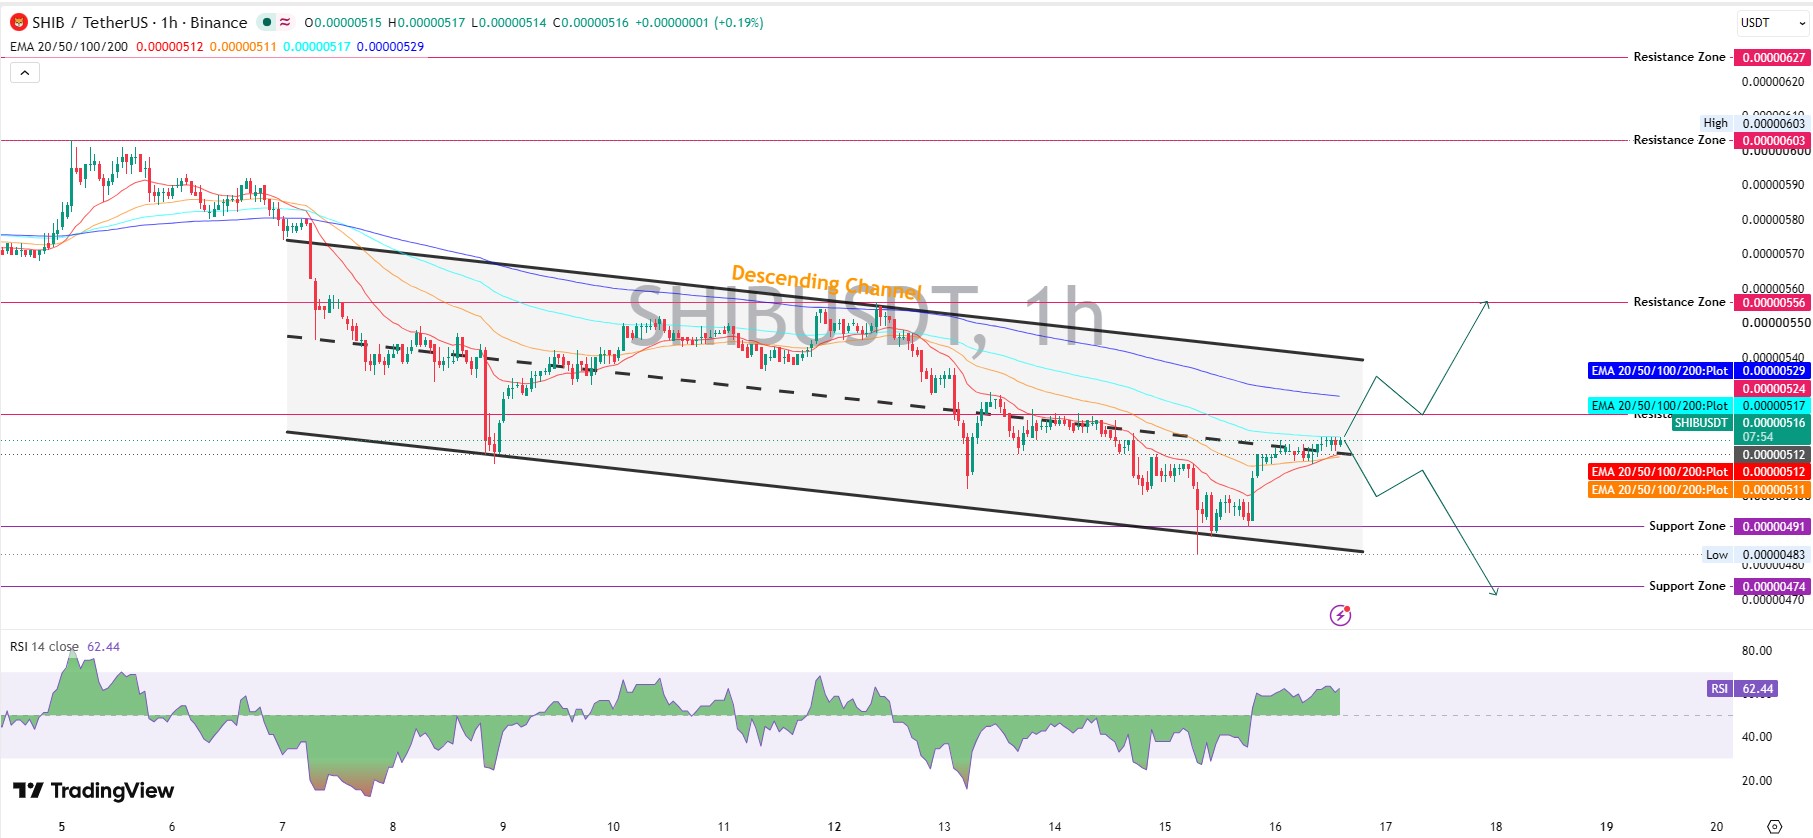
SHIB technical analysis on the TradingView 1-hour chart shows SHIB/USDT on Binance trading inside a descending channel, sitting near its midline.
RSI reads 62.44. Above 50 favors buyers, and below 70 leaves room before overheating. That reading feels healthy. Then again, momentum built fast, and fast climbs often cool off first.
An EMA is a moving average that weights recent trading more heavily. The 20 EMA sits at $0.00000512, the 50 EMA at $0.00000511, the 100 EMA at $0.00000517, and the 200 EMA at $0.00000529.
Price near $0.00000516 trades above the first two. But the other two still cap rallies, so is this a reversal or a pause? Two EMAs reclaimed. Two to go.
Support Levels
Support is a floor where buyers stepped in before. $0.00000512 comes first, where the channel midline and two EMAs overlap. Below that sit $0.00000491, $0.00000483 and $0.00000474.
Resistance Levels
Resistance is a ceiling where sellers appeared before. $0.00000517, $0.00000524, and $0.00000529 stack up quickly.
Beyond them, wait $0.00000556, $0.00000603, and $0.00000627, with the upper channel line near $0.00000540.
Can Shiba Inu Rally Continue? Three Scenarios
The SHIB price prediction for the next 24 to 72 hours hinges on $0.00000512. Early September's falling wedge setup showed how fast these patterns flip.
Bull Case
Can SHIB reach $0.00000556? Only if $0.00000512 holds and $0.00000529 breaks with rising volume, then $0.00000603 comes next. A slide below $0.00000491 cancels it.
Base Case
If $0.00000512 holds, the price will likely move sideways between $0.00000512 and $0.00000529 as long as trading volume stays low.
Bear Case
Losing $0.00000512 could pull the price toward $0.00000491, then $0.00000483, and $0.00000474. Bias flips bearish there.
Shiba Inu Price Forecast: Long-Term View
Price trades 94.18% below the $0.00008845 all-time high set on October 28, 2021. This Shiba Inu price prediction treats anything past $0.00000627 as guesswork.
August's Japan listing milestone lifted sentiment once. But headlines fade.
Risks That Could Change the Forecast
Three risks stand out. Thin volume, whale concentration at 94.69%, and a Bitcoin pullback from $81,992.87. And capital rotating toward themes in AI crypto news could drain meme coin flows.
Final Takeaway
This rebound is a relief bounce, not a trend change. The Shiba Inu price prediction stays cautious while volume lags.
Bulls need $0.00000529. Bears need $0.00000491. More setups sit in the crypto price predictions hub.
Disclaimer: This article is for informational purposes only and isn't financial advice. Crypto markets are volatile, and prices can move sharply in either direction. Readers should research independently and consult a licensed advisor before making decisions.
















