Shiba Inu Price Prediction: SHIB Sell-Off Warning! Is a New Low Next?

A post warns that $SHIB may end the year on a sad note, with selling pressure pinning the price near a 2026 low. Is that close? Price sits only 0.9% above its nearest support at $0.000004804, and it trades under all four EMAs.
This Shiba Inu Price Prediction explains the chart step by step and checks it against the liquidation data.
Market data checked on October 27, 2026, at 11:45 IST.
Shiba Inu Price Prediction Today: Market Overview
Metric | Value |
Price (TradingView OKX daily chart) | $0.000004848 |
Daily Candle Change | -0.90% |
Candle Open | $0.000004893 |
Candle Range | $0.000004820 – $0.000004904 |
Shiba Inu News Today: Post Warns of a 2026 Low
SHIB might end the year on a sad note as selling pressure rises. It asks if $SHIB will hit its 2026 low because the price is too close to it. The post gives no price level or data, so CoinGabbar could not verify it.
Source: Data From X
Crypto News Today: SHIB Liquidation and Futures Volume
A liquidation happens when an exchange force-closes a leveraged trade because the trader can no longer cover losses. Longs bet on a rise, and shorts bet on a fall.
Window | Total Liquidated | Long | Short |
12h | $6.31K | $6.20K | $108.28 |
24h | $21.04K | $12.58K | $8.46K |
Source: Data From CoinGlass
Longs took about 60% of the $21.04K liquidated over 24 hours and about 98% of the 12-hour total. The amounts are very small, so forced selling is not driving this move.
Coinglass futures volume leads with OKX at $7.11M, LBank at $5.86M, Bitget at $3.41M, MEXC at $3.26M and WhiteBIT at $2.73M. The screenshot gives no time window.
Shiba Inu Price Prediction: Chart Analysis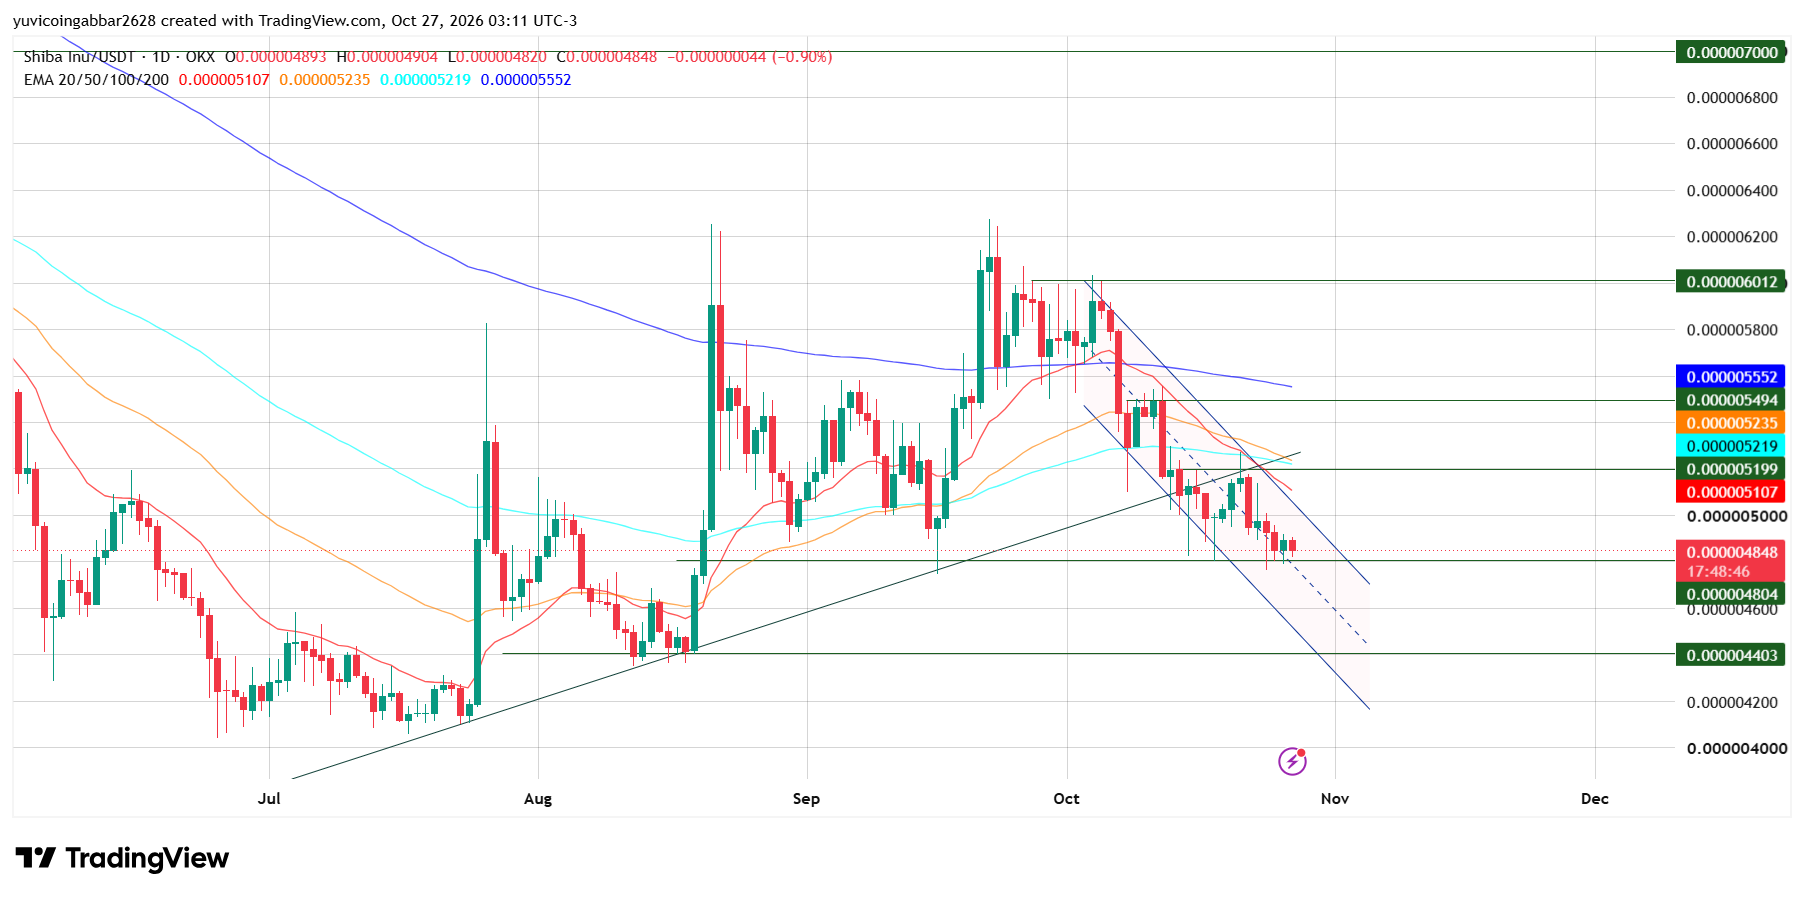
From late June, SHIB climbed along a rising trendline, which joins higher lows. In early October the price fell under that trendline. It then bounced around October 21, but the move stalled at $0.000005199, near the broken trendline and the EMAs.
Since then, the price has made lower highs and lower lows inside a falling channel, a pair of downward-sloping boundaries. Today's candle opened at $0.000004893, ranged from $0.000004820 to $0.000004904 and printed $0.000004848.
The 20 EMA sits below both the 50 and 100 EMAs, a bearish setup where short-term momentum trails the medium term.
EMA | Value | Position vs Price |
EMA 20 (red) | $0.000005107 | Above price, about 5.3% |
EMA 50 (orange) | $0.000005235 | Above price, about 8.0% |
EMA 100 (cyan) | $0.000005219 | Above price, about 7.7% |
EMA 200 (blue) | $0.000005552 | Above price, about 14.5% |
Shiba Inu Forecast: Support and Resistance Levels
Type | Level |
Highest marked level | $0.000007000 |
Resistance 3 | $0.000006012 |
Resistance 2 | $0.000005494 |
Resistance 1 | $0.000005199 |
Immediate support | $0.000004804 |
Deeper support | $0.000004403 |
Bull case: A daily close above the 20 EMA at $0.000005107 and then $0.000005199 would be a first recovery sign.
Bear case: If $SHIB closes below $0.000004804, the price could slide about 9% toward $0.000004403. The chart's June and July lows sit below that level, so the post's 2026 low would be further down.
SHIB Long-Term Price Target Levels
Level | SHIB Price |
Current Price | $0.000004848 |
Support | $0.000004021 |
Target 1 | $0.000006023 |
Target 2 | $0.000015994 |
Target 3 | $0.000032126 |
SHIB Scenarios and Invalidation (October 27, 2026)
Scenario | Trigger | Likely Outcome | Invalidation |
Bull | Close above $0.000005199 | Move toward $0.000005494 | Close below $0.000004804 |
Base | Range of $0.000004804 to $0.000005107 | Sideways under the EMAs | Break of either level |
Bear | Close below $0.000004804 | Slide toward $0.000004403 | Close back above $0.000004804 |
Shiba Inu Price Prediction: Can $SHIB Reach $0.000006012?
It would take a gain of about 24% from $0.000004848. Any Shiba Inu forecast toward that level needs more than headlines, since SHIB must clear all four EMAs and $0.000005494 first.
Shiba Inu Price Prediction 2026: CoinGabbar Technical View
Price sits just above $0.000004804 and under every EMA, so the setup stays cautious until SHIB closes above $0.000005107.
Disclaimer
This article is for informational purposes only and isn't financial advice. Crypto markets are volatile. Always do your own research before making any trading decisions involving SHIB.



















