Shiba Inu Price Prediction: FOMC Countdown! Is SHIB About to Surge?

SHIB is trading 3.2% above its nearest support just hours before the Federal Reserve's rate decision. Will FOMC day break that floor? The chart shows the price already below a rising channel it has held since June.
This Shiba Inu Price Prediction covers the FOMC update, the burn and liquidation data and a step-by-step chart read.
Market data checked on October 28, 2026, at 11:37 IST, before the Fed decision.
Shiba Inu Price Prediction Today: Market Overview
Metric | Value |
Price (TradingView OKX daily chart) | $0.000004961 |
Daily Candle Change | +2.59% |
Market Cap (price tracker) | $2.92B |
24h Volume (price tracker) | About $52.3M |
Why is the Shiba Inu price up today?
The Shiba Inu price today is up 2.59% to $0.000004906 in 24 hours, slightly outperforming a broader market rebound primarily driven by beta-driven momentum with Bitcoin.
FOMC Update: What the Fed Decides Today
The FOMC, the Fed's rate-setting committee, meets on October 27 and 28. Its decision is due at 2 pm Eastern on October 28, about 11:30 pm IST.
The rate sits at 3.75%–4.00% after a quarter-point hike in September, the first in about three years. Kiplinger's live coverage cites CME FedWatch odds near 90% for a hold today and 73% for a hike in December.
Shiba Inu News: 1.43M $SHIB Burned in One Hour
Shibburn posted that 1,428,446 $SHIB were burned in the past hour across 2 transactions. A burn sends tokens to a wallet that nobody can spend from, which cuts supply. At the chart price, that is about $7.
Source: Data From X
CoinGabbar could not verify the figure.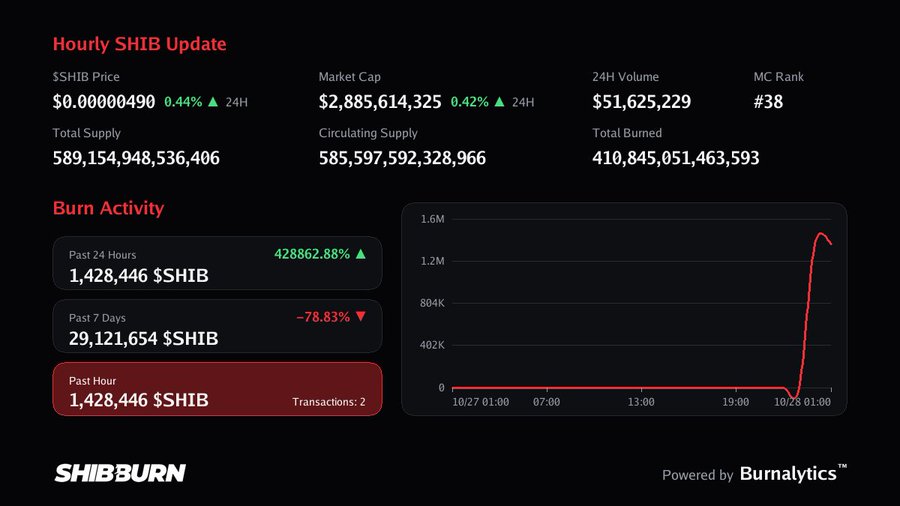
SHIB Liquidation Data Before FOMC Meet
A liquidation happens when an exchange force-closes a leveraged trade because the trader can no longer cover losses. Longs bet on a rise, and shorts bet on a fall.
Window | Total Liquidated | Long | Short |
12h | $1.53K | $744.70 | $782.84 |
24h | $5.29K | $3.66K | $1.64K |
Source: Data From CoinGlass
Longs took about 69% of the $5.29K liquidated over 24 hours, while the 12-hour split is nearly even. The amounts are tiny.
SHIB Prediction: FOMC Day Chart Analysis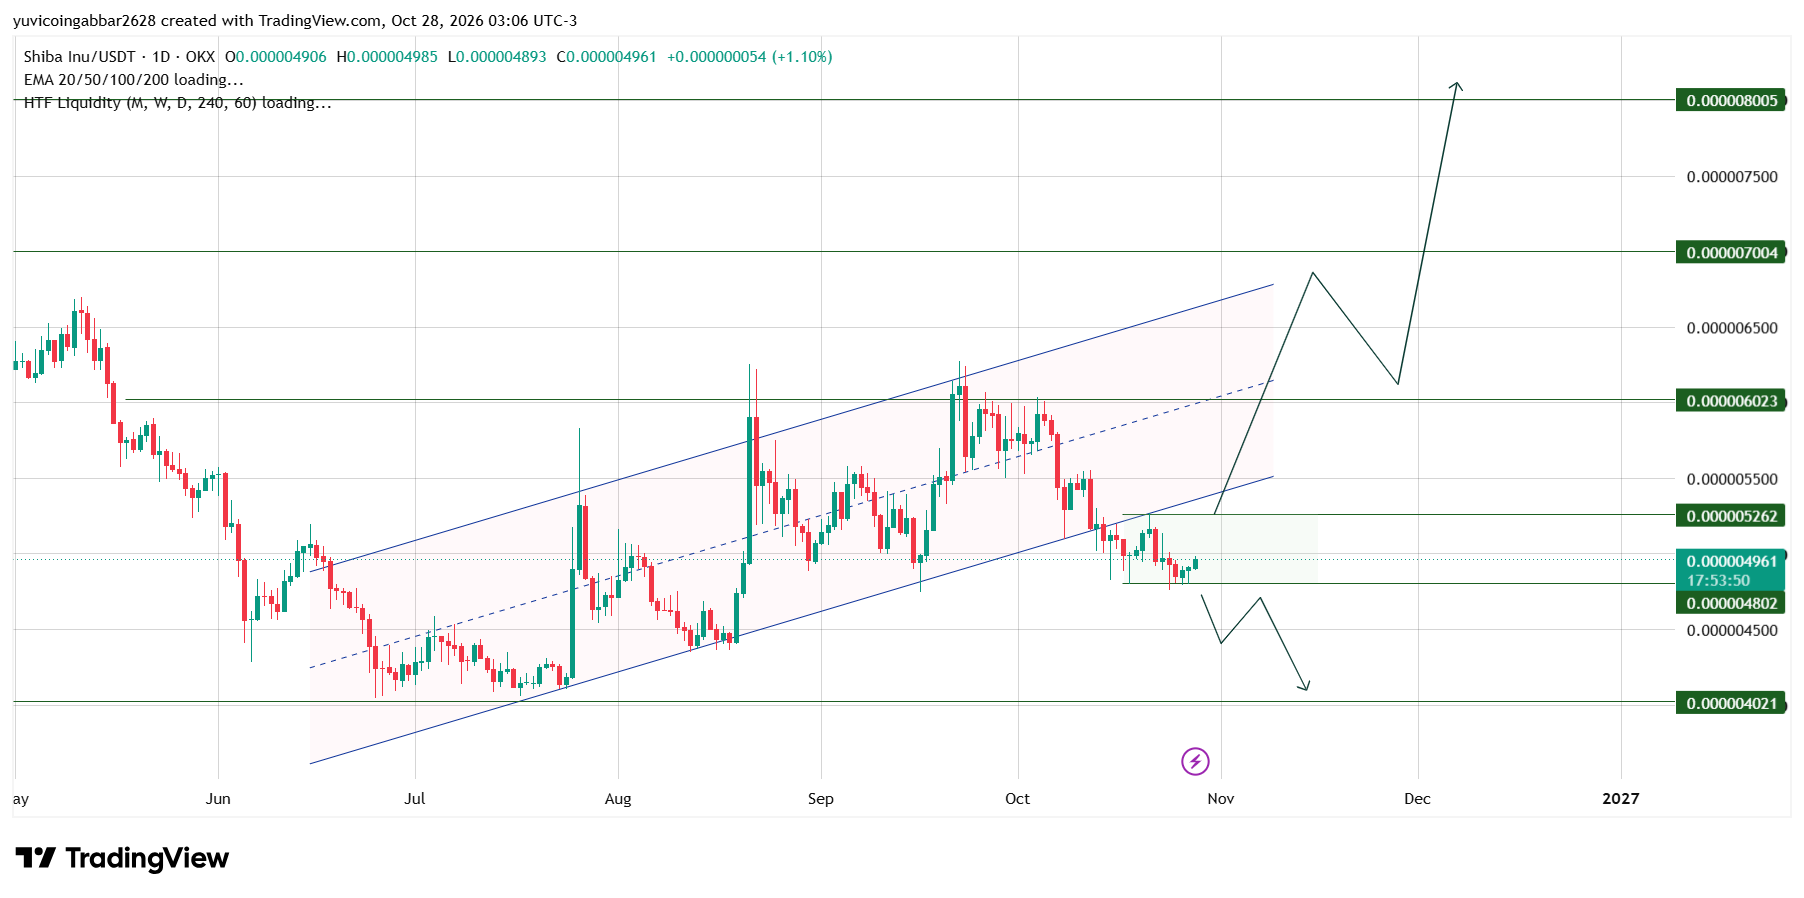
SHIB rose from lows near $0.000004021 in June and July to about $0.0000062 in September. It climbed inside a rising channel, a pair of upward-sloping boundaries that hold price in a range.
In early October, the price fell below the channel's lower boundary. A break like that means the old floor can act as a ceiling. Since mid-October, SHIB has moved sideways between $0.000004802 and $0.000005262, the shaded box on the chart.
Today's candle opened at $0.000004906, ranged from $0.000004893 to $0.000004985 and printed $0.000004961. The $0.000005262 level sits near the channel's lower boundary, so it is the first hurdle.
Shiba Inu Forecast: Support and Resistance Levels
Type | Level |
Highest marked level | $0.000008005 |
Resistance 3 | $0.000007004 |
Resistance 2 | $0.000006023 |
Resistance 1 | $0.000005262 |
Immediate support | $0.000004802 |
Deeper support | $0.000004021 |
Bull case: A daily close above $0.000005262, about 6% higher, would lift $SHIB out of its box and back toward the channel's lower boundary and $0.000006023.
Bear case: If $SHIB closes below $0.000004802, the price could slide about 16% toward $0.000004021.
SHIB Scenarios and Invalidation (October 28, 2026)
Scenario | Trigger | Likely Outcome | Invalidation |
Bull | Close above $0.000005262 | Move toward $0.000006023 | Close below $0.000004802 |
Base | Range of $0.000004802 to $0.000005262 | Sideways in the box | Break of either level |
Bear | Close below $0.000004802 | Slide toward $0.000004021 | Close back above $0.000004802 |
Can Shiba Inu Reach $0.000006023?
It would take a gain of about 21% from $0.000004961. Any SHIB price prediction toward that level needs more than a burn headline.
Shiba Inu Price Prediction: Expert Analysis
SHIB is a high-risk meme token with thin trading, about $52.3M a day against a $2.92B market cap. Moves around macro events can be fast. Rate hikes raise yields and can pull money from risk assets, so a surprise hike or a hawkish tone in December could push SHIB toward $0.000004802.
A hold with a calm message is already expected, so it may do little on its own. A softer tone could help SHIB test $0.000005262.
The level to watch is $0.000004802. A daily close below it would break the box and open the way to $0.000004021, while a close above $0.000005262 would be the first real sign of strength.
Disclaimer
This article is for informational purposes only and isn't financial advice. Crypto markets are volatile. Always do your own research before making any trading decisions involving SHIB.



















