Shiba Inu Price Prediction: Can SHIB Clear the 200 EMA for a breakout?


Shiba Inu has staged a sharp rally over the past few weeks, and traders are now watching whether that strength can carry through a key technical test.
Shiba Inu launched in August 2020 as a decentralized meme token positioned as an alternative to Dogecoin.
It has since expanded into a broader ecosystem, including the Shibarium layer-2 network, while holding onto one of the largest and most active communities in crypto.
This Shiba Inu price prediction examines whether the current daily setup can support a move toward new highs or whether momentum stalls near current levels.
As of September 25, 2026, Shiba Inu (SHIB) trades at $0.00000577, up 0.6% over the past 24 hours.
Shiba Inu's market capitalization stands at $3.399 billion, with a fully diluted valuation of $3.4 billion. Circulating supply sits at 589.239 trillion $SHIB against a total supply of 589.496 trillion.
Live Shiba Inu Market Data
Metric | Value |
Price | $0.00000577 |
24h Change | +0.6% |
24h Range | $0.00000555 - $0.00000586 |
Market Cap | $3.399B |
Source: market data taken from CoinGecko, as of Sep 25, 2026. Figures may vary slightly across other tracking websites.
Shiba Inu News Today Analysis
Shibburn, a widely followed SHIB burn-tracking service, reported that burn activity has picked up sharply. 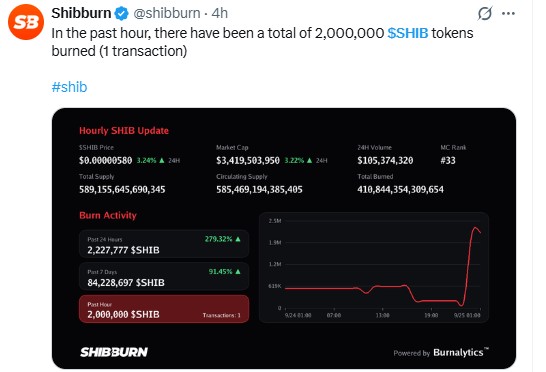
Source: Data Taken From @shibburn, X Account, as of Sep 25, 2026
Its hourly update showed 2,000,000 $SHIB burned in a single transaction over the past hour, with burn activity up 279.32% over the past 24 hours and up 91.45% over the past seven days.
The tracker put total burned supply at over 410.8 trillion SHIB. Rising burn activity is often watched by holders as a sign of renewed network engagement, though a single-hour spike does not by itself confirm a sustained trend.
Separately, U.Today reported that Shiba Inu's exchange activity is flashing a bullish signal even as price has pulled back in the short term. 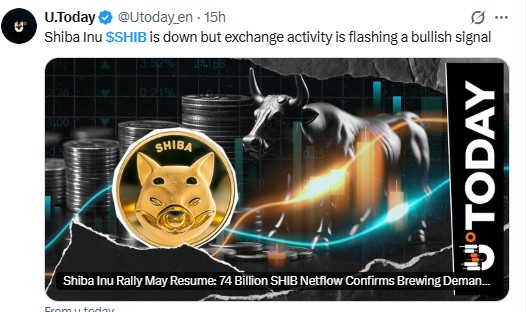
Source: Data Taken From @Utoday_en, X Account, as of Sep 25, 2026
The outlet's coverage pointed to a reported 74 billion $SHIB net outflow from exchanges as a sign of brewing demand, with holders moving tokens off trading platforms rather than positioning to sell.
Technical Analysis
Shiba Inu technical analysis on the daily chart shows $SHIB trading above a rising trendline that has supported price since July.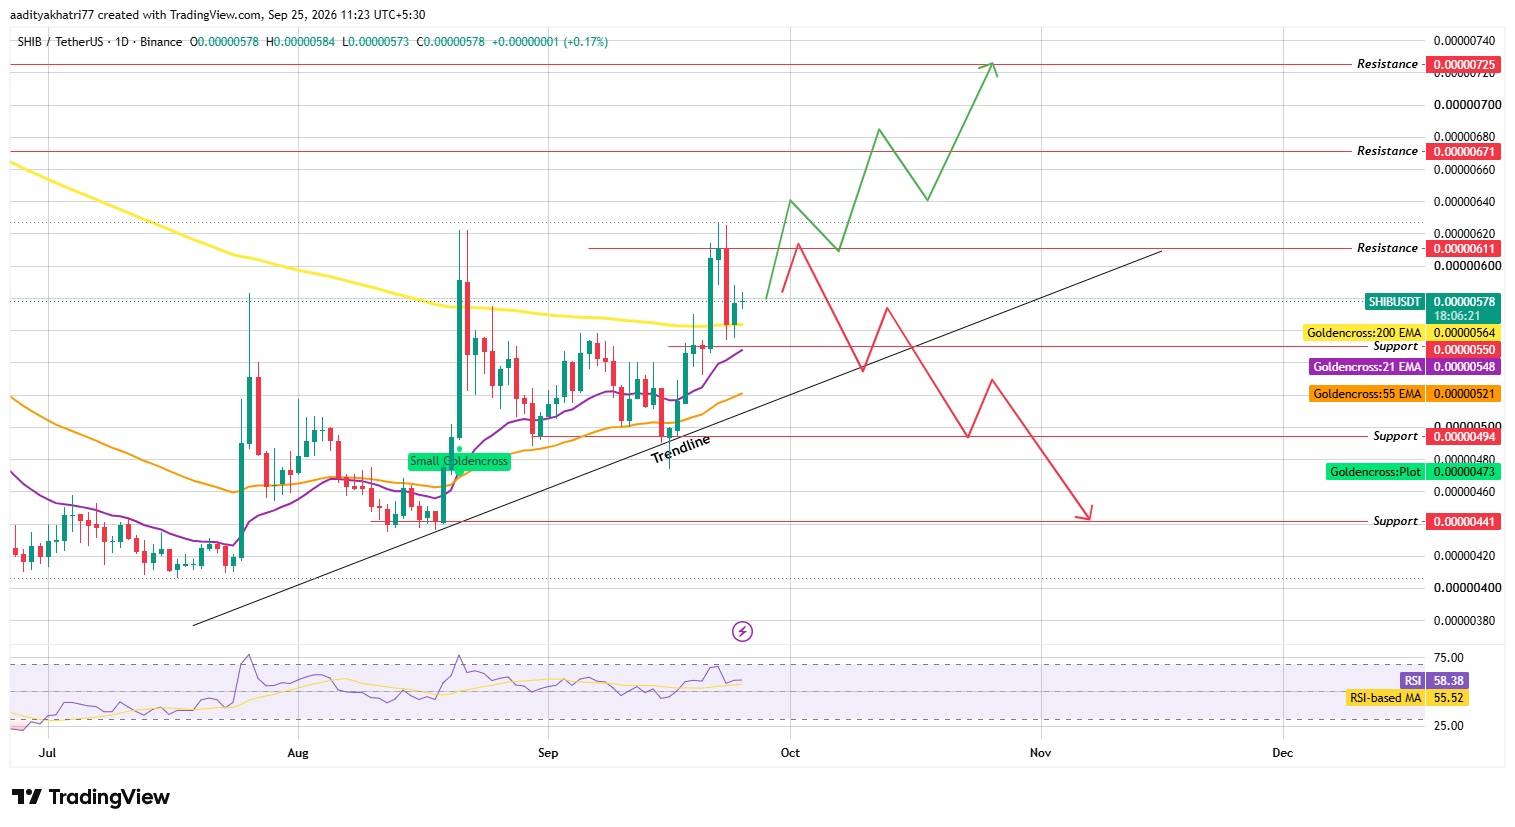
Source: Chart taken from TradingView, as of Sep 25, 2026
The token is currently testing its 200 EMA at $0.00000564, sitting just above the shorter-term 21 EMA at $0.00000548 and the 55 EMA at $0.00000521.
The Relative Strength Index reads 58.38, above its moving average of 55.52, pointing to steady bullish momentum without overbought conditions.
Can $SHIB Break Resistance and Extend the Rally?
If Shiba Inu clears the 200 EMA and pushes through the first resistance at $0.00000611, the path opens toward $0.00000671.
A sustained move beyond that level could extend this Shiba Inu price prediction toward $0.00000725, provided buying volume holds up through the move.
These levels represent the key resistance zones the market will be watching over the coming sessions.
What Happens If $SHIB Gets Rejected at Resistance?
If SHIB fails to clear resistance and gets turned away, price would likely retest the rising trendline and the support zone near $0.00000550.
A break of both the trendline and this support would expose $SHIB to a decline toward $0.00000494, with a deeper slide toward $0.00000441 possible if selling pressure builds further.
Support and Resistance Levels
Support | Resistance |
$0.00000550 | $0.00000611 |
$0.00000494 | $0.00000671 |
$0.00000441 | $0.00000725 |
$SHIB Bull, Base, and Bear Scenarios
Scenario | Setup | Level |
Bull | Break above the 200 EMA and resistance with volume. | $0.00000611 - $0.00000725 |
Base | Consolidation between trendline and resistance | $0.00000550 - $0.00000611 |
Bear | Rejection at resistance, trendline, and support break | $0.00000494 - $0.00000441 |
Shiba Inu vs Bitcoin
Shiba Inu's price action has generally tracked Bitcoin's broader market cycle, though SHIB tends to see amplified moves in both directions given its meme-driven, retail-heavy trading base.
Periods of Bitcoin stability have historically coincided with stronger altcoin performance, and this dynamic remains relevant to how far the current $SHIB rally can extend.
Methodology
This Shiba Inu price prediction is based on a review of the daily SHIB/USDT chart, covering trendline structure, EMA levels, support and resistance zones, and RSI momentum readings.
Market data was sourced from live exchange feeds as of the article's publish date, and burn and netflow figures were drawn from Shibburn and U.Today reporting. This analysis does not constitute financial advice.
Expert Opinion
Analysts tracking Shiba Inu technical analysis note that a token holding above a rising trendline while testing a major moving average like the 200 EMA often signals a decision point rather than a guaranteed continuation.
Several also point out that on-chain signals, such as rising burn rates or exchange outflows, can support a bullish case but should be weighed alongside price action rather than treated as standalone triggers.
Disclaimer: This article is for informational purposes only and does not constitute financial advice. Cryptocurrency markets are highly volatile, and prices can fall well below the levels discussed here. The price levels above are based on technical analysis and are not guaranteed outcomes. Readers should conduct their own research and consult a licensed financial advisor before making any investment decisions.

















