Shiba Inu Price Prediction: Will SHIB Repeat the 167% October Pattern?


Shiba Inu is down 8.1% today, yet a fresh headline says it just finished its most bullish quarter on record.
That contrast frames this Shiba Inu price prediction, as traders weigh a sharp one-day pullback against a strong quarterly record.
Shiba Inu launched in August 2020 under the pseudonym Ryoshi as a dog-themed token on Ethereum, inspired by Dogecoin.
The Shiba Inu coin later added Shibarium, its own layer-2 network, and a burn program to reduce supply. It now ranks 33rd by market cap.
The Shiba Inu price today is $0.00000571, down 8.1% over 24 hours and 4.5% against Bitcoin.
The 24-hour range runs from $0.00000556 to $0.00000622. Market cap is $3.367 billion, and daily trading volume is $150.978 million.
SHIB Coin Live Market Data
Metric | Value |
Price | $0.00000571 |
24h Change | -8.1% |
24h Range | $0.00000556 to $0.00000622 |
Market Cap | $3.367B |
Fully Diluted Valuation | $3.369B |
24h Trading Volume | $150.978M |
Circulating Supply | 589.239T |
Total Supply | 589.496T |
Market Cap Rank | #33 |
Source: market data taken from CoinGecko, as of Sep 24, 2026. Figures may vary slightly across other tracking websites.
Shiba Inu News: U.Today Points to a Bullish Q3
The latest Shiba Inu news comes from U.Today. The outlet reported that SHIB has ended its most bullish third quarter in its history. Its article also says October carries a historical pattern of about 167%.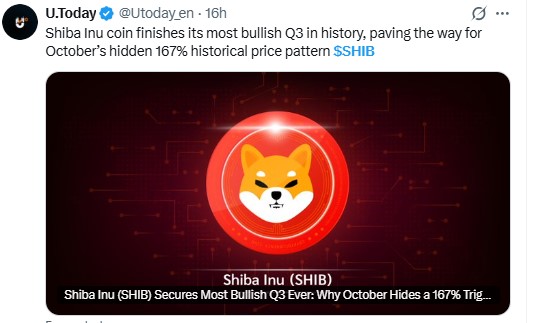
Source: Data Taken From @Utoday_en, X Account, as of Sep 24, 2026
That figure needs careful reading. A monthly pattern describes past behavior and does not promise a repeat. A 167% gain from the chart price of $0.00000577 would put SHIB near $0.0000154.
Market cap would rise to about $9.1 billion, up from $3.4 billion today. The 4H chart shows no level near that area, and its highest resistance is $0.00000670, about 16.1% above the chart price.
The quarterly claim comes from the outlet and was not independently checked here. Readers should treat the 167% number as background from a media report, not as a target.
Shiba Inu Technical Analysis: 4H Ascending Channel
This Shiba Inu price prediction September 2026 view uses the 4-hour SHIB/USDT chart on Binance, captured at 10:33 IST (UTC+5:30) on September 24, 2026.
Price has moved inside an ascending channel since about September 15. The sharp drop on September 23 pulled $SHIB down to the lower boundary, where buyers stepped in. The current bounce started from that line.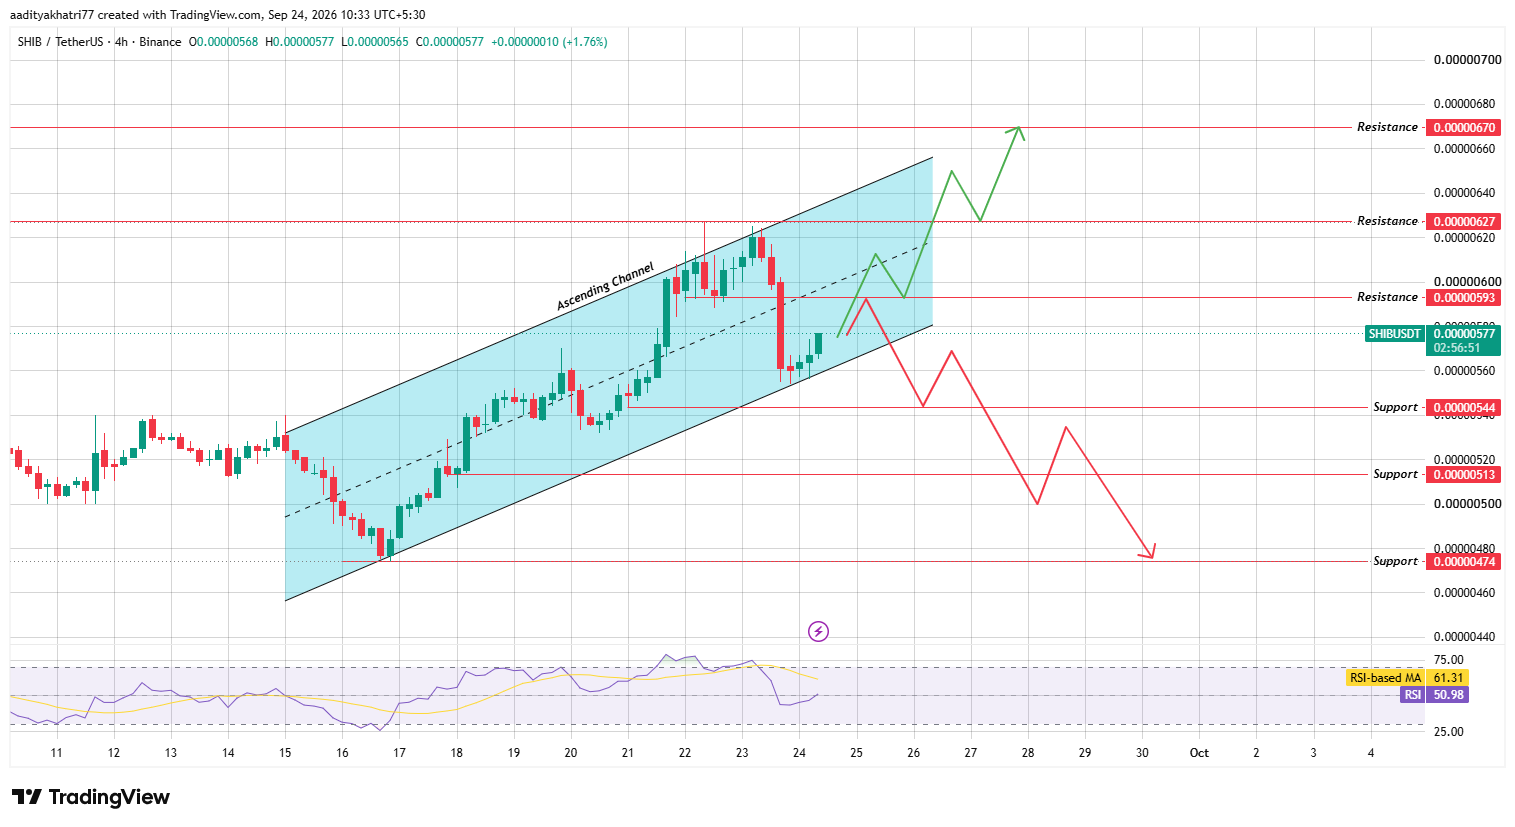
Source: Chart taken from TradingView, as of Sep 24, 2026
The RSI reads 50.98, below its moving average of 61.31.
Earlier this week it climbed close to the overbought area, so momentum has cooled and now sits near neutral. That leaves the next 4H candle closing with real weight.
Shiba Inu Price Prediction: Can $SHIB Break Resistance?
The bullish case depends on the lower boundary holding. The first hurdle is $0.00000593, about 2.8% above the chart price and close to the channel midline.
A 4H body close above it would confirm a move, and volume should reach at least 1.5 times the average of the previous 20 candles.
A wick above the line without such a close does not count.
Next comes $0.00000627, roughly 8.7% higher, which matches the highs of September 22 and 23.
Beyond it sits $0.00000670, about 16.1% above the chart price.
The chart also allows a dip back toward the channel middle before the higher leg. That would be a normal retest and would not cancel the setup.
What Happens If Shiba Inu Is Rejected at Resistance?
The bearish case starts with rejection near $0.00000593. Price would then slide back toward the lower boundary of the channel.
A 4H body close under that boundary and below $0.00000544 would break the structure.
The first floor is $0.00000544, about 5.7% under the chart price. Below it lies $0.00000513, roughly 11.1% lower.
The final level is $0.00000474, about 18% down, which matches the mid-September low that began the channel.
The chart marks two small bounces along the way, so a decline would probably not be a straight line.
Shiba Inu Coin Price Levels
Support | Resistance |
$0.00000544 | $0.00000593 |
$0.00000513 | $0.00000627 |
$0.00000474 | $0.00000670 |
Shiba Inu Coin Bull, Base, and Bear Scenarios
Scenario | Setup | Level |
Bull | 4H body close above $0.00000593 with strong volume | $0.00000627, then $0.00000670 |
Base | Price holds inside the channel above $0.00000544 but stays below $0.00000593. | $0.00000544 to $0.00000593 |
Bear | 4H close below the lower boundary and $0.00000544 | $0.00000513, then $0.00000474 |
Shiba Inu vs Bitcoin
SHIB fell 8.1% in dollar terms and 4.5% against Bitcoin. Those figures imply Bitcoin lost roughly 4% in the same 24 hours.
About half of the decline tracks the wider market, and the rest belongs to SHIB.
Small-cap meme tokens usually move harder than Bitcoin in both directions. A steady Bitcoin would help the breakout case above $0.00000593.
Fresh Bitcoin weakness would raise the risk of a close below the channel.
Methodology
This Shiba Inu price prediction draws on the 4H SHIB/USDT chart from Binance on TradingView, CoinGecko market data, and a report from U.Today on SHIB's quarterly record.
No liquidation, exchange volume, or wallet data was supplied.
Burn figures from Shibburn and activity data from Shibarium were also not part of the inputs, so none of them is used.
The volume threshold for confirmation is an analytical criterion, not an exchange-reported number.
The Shiba Inu price prediction 2026 view will be revised as new 4H candles close.
Expert Opinion
General market commentary on SHIB this week has split into two camps. One points to the strong quarterly record.
The other focuses on the sharp one-day drop. Analysts who follow meme tokens usually read a hold at the lower edge of an ascending channel as constructive.
A close below it is treated as the first sign of a trend change.
Monthly patterns like the one U.Today's citations are generally used as context, since a single month offers a small sample.
Any Shiba Inu price prediction works best alongside a fixed exit plan, because SHIB fell 8.1% in one day.
Disclaimer: This article is for information only and is not financial advice. SHIB is highly volatile and fell 8.1% in 24 hours. Technical levels can fail, and price can move against every scenario above, including a total loss of invested capital. The scenarios carry no stated probability. Do your own research and never risk money you cannot afford to lose.

















