Shiba Inu Price Prediction: The Real Reason Why SHIB Surged 9% Today

Shiba Inu has climbed sharply over the past day, and the timing of the move has traders asking whether something specific triggered it or whether the rally is simply part of a broader market swing.
This shiba inu price prediction looks at both the price action and the news behind it to separate coincidence from cause.
Shiba Inu launched in 2020 as an Ethereum-based token inspired by the Shiba Inu dog breed. What began as one of many meme-inspired projects grew into one of the largest tokens by market capitalization, later expanding into its own ecosystem through the Shibarium network.
Today, shiba inu coin remains one of the most actively traded assets in the meme coin category, with a large global holder base.
The Shiba Inu price today stands at $0.00000605, up 9.3% over the past 24 hours.
The token's market capitalization has reached $3.568 billion, placing it among the more actively watched large-cap meme assets.
Live Market Data
Metric | Value |
Price | $0.00000605 |
24h Change | +9.3% |
24h Range | $0.00000550 - $0.00000613 |
Market Cap | $3.568B |
Fully Diluted Valuation | $3.57B |
24h Trading Volume | $222.408M |
Circulating Supply | 589.239T |
Total Supply | 589.496T |
Source: market data taken from CoinGecko, as of Sep 22, 2026. Figures may vary slightly across other tracking websites.
Exchange Volume
Trading activity in $SHIB remains concentrated on a handful of major exchanges. LBank leads futures volume with $43.96 million, followed closely by OKX at $37.51 million. 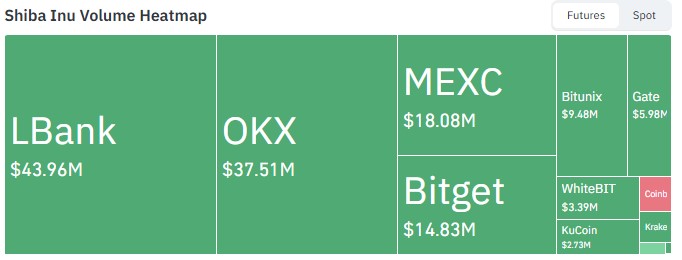
Source: Volume Heatmap Data Taken From CoinGlass, As of Sept 22, 2026.
MEXC and Bitget contribute $18.08 million and $14.83 million, respectively, while Bitunix and Gate add a combined $15.46 million.
Smaller contributions from WhiteBIT, KuCoin, and Kraken round out the remaining volume.
This spread across multiple platforms suggests the current rally is broad-based rather than driven by a single exchange's order flow.
Liquidation Data
Timeframe | Total Liquidated | Longs | Shorts |
1h | $1.87K | $142.91 | $1.73K |
4h | $17.67K | $15.84K | $1.83K |
12h | $66.17K | $32.36K | $33.81K |
24h | $178.84K | $39.11K | $139.73K |
Source: Liquidation Data Taken From CoinGlass.
Short positions have taken the brunt of the damage over the past 24 hours, with $139.73K in short liquidations compared to $39.11K on the long side.
This pattern typically points to a short squeeze, where traders betting against the price were forced to close positions as SHIB moved higher, adding further upward pressure.
The shift toward long-side liquidations in the most recent hour suggests the pace of gains may be slowing.
Shiba Inu News Today: Shibarium Upgrade in Focus
According to a report from BSCN, Shiba Inu is undergoing several infrastructure upgrades, with the Shibarium Layer 2 reorganization being one of the more significant changes underway. 
Source: Data Taken From @BSCNews, X Account, as of Sep 22, 2026
The outlet raised questions about how this reorganization could affect the broader Shibtoken ecosystem going forward.
While the report does not tie a specific price target to the upgrade, the timing has coincided with today's move higher, and traders following shiba inu news have pointed to it as a possible contributing factor alongside the short squeeze visible in the liquidation data.
Technical Analysis: SHIB Testing Channel Resistance
On the 4-hour chart, SHIB is trading inside an ascending channel and is currently testing the upper boundary near $0.00000622.
The candle attempting this move has not yet closed, so the breakout remains unconfirmed. 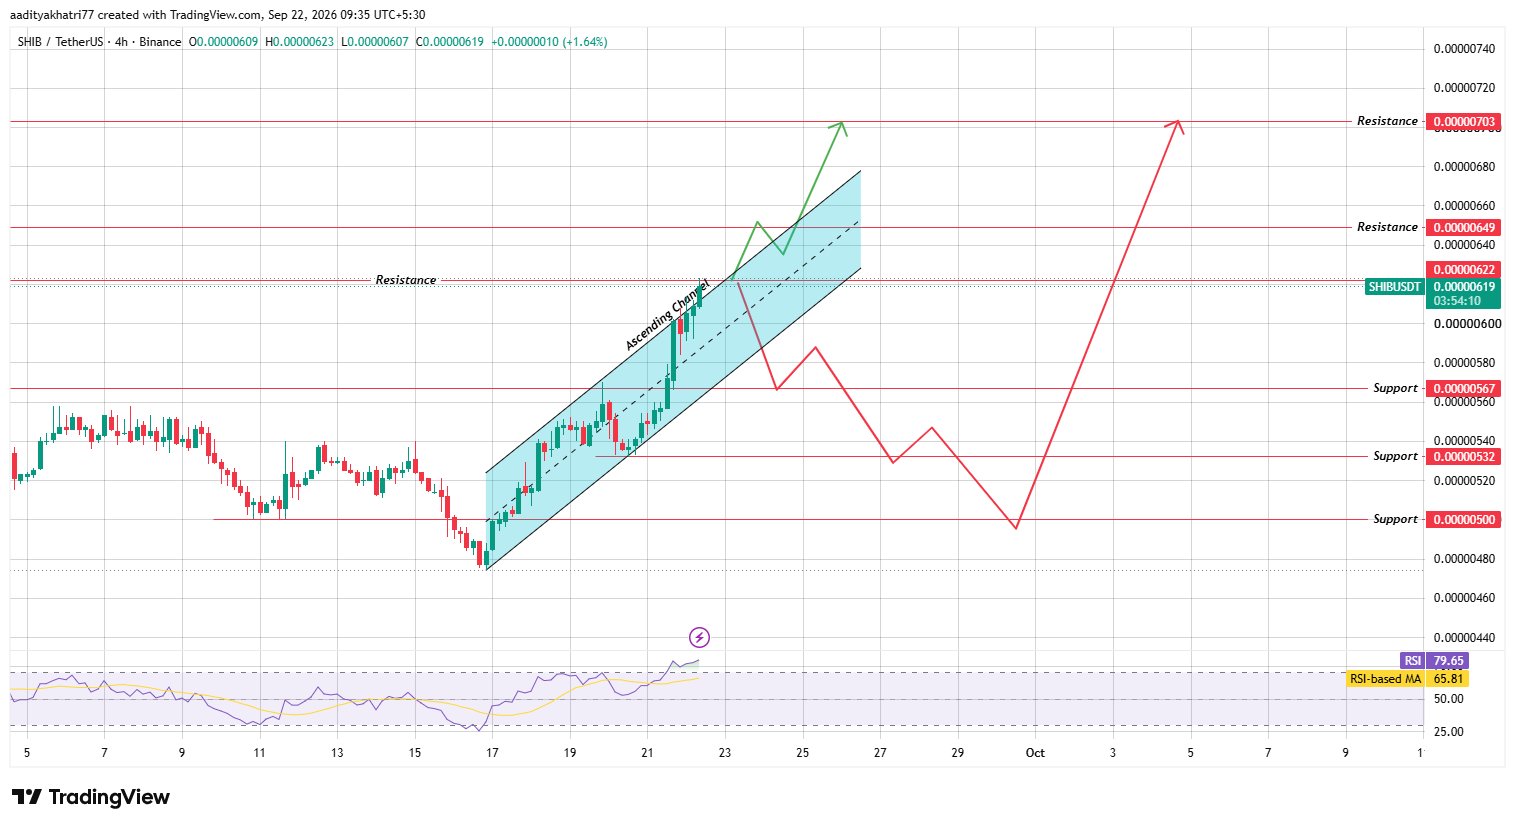
Source: Chart taken from TradingView, as of Sep 22, 2026
RSI sits at 79.65, above its moving average of 65.81, reflecting strong momentum but also entering overbought territory.
Can $SHIB Push Toward Higher Resistance?
If the current 4-hour candle closes above $0.00000622 with sustained volume, SHIB would confirm a breakout from the ascending channel.
This scenario opens a path toward $0.00000649, and a continuation beyond that level could bring $0.00000703 into view.
A confirmed close above resistance, rather than an intraday wick, would be the key signal traders should watch for before treating the breakout as valid.
What Happens If $SHIB Is Rejected?
Should the price fail to hold above $0.00000622 and instead reverse lower, SHIB would likely retest the $0.00000567 support level first.
A break below that zone would expose $0.00000532, and continued selling pressure could extend the decline toward $0.00000500.
Given the elevated RSI reading, a pullback to cool off momentum would not be unusual even within a broader uptrend.
Support and Resistance Levels
Support | Resistance |
$0.00000567 | $0.00000622 |
$0.00000532 | $0.00000649 |
$0.00000500 | $0.00000703 |
Bull, Base, and Bear Scenarios
Scenario | Setup | Level |
Bull | Confirmed breakout above channel resistance | $0.00000649 - $0.00000703 |
Base | Price consolidates within the channel. | $0.00000600 - $0.00000622 |
Bear | Rejection and breakdown below support | $0.00000532 - $0.00000500 |
SHIB vs Bitcoin
Shiba Inu's price action has broadly tracked Bitcoin's recent stability, though today's 9.3% move outpaces Bitcoin's typical daily range by a wide margin.
This suggests SHIB's rally is being driven more by asset-specific factors, including the Shibarium news and short-side liquidations, than by broader market momentum alone.
When Bitcoin holds steady, meme coins like SHIB often see amplified moves in either direction, and today's data reflects that pattern.
Methodology
This shiba inu technical analysis is based on 4-hour candlestick data from Binance, sourced through TradingView, combined with live market data, exchange volume, and liquidation figures from CoinGecko and CoinGlass.
Support and resistance levels are drawn directly from the ascending channel structure visible on the chart, and RSI readings are used to assess momentum.
All figures reflect data captured as of September 22, 2026, and are subject to change as trading continues.
Expert Opinion
Market analysts tracking meme coin momentum note that short squeezes, like the one visible in SHIB's 24-hour liquidation data, often produce sharp but short-lived rallies unless followed by sustained volume.
A confirmed close above the channel's upper boundary would be needed to shift the near-term outlook from a squeeze-driven spike to a more durable trend change.
Disclaimer: This article is for informational purposes only and should not be considered financial advice. Cryptocurrency markets are highly volatile, and prices can move sharply in either direction. The scenarios outlined above are based on current chart patterns and are not guaranteed outcomes. Readers should conduct their own research and consider their risk tolerance before making any investment decisions.