SPX6900 Price Prediction: Can SPX Break Out of Its Descending Channel?


The latest SPX6900 price prediction centers on a descending channel on the daily chart.
$SPX is trading near the middle of the channel, and the next daily closes could decide the direction.
The SPX6900 coin is down 2.1% over the last 24 hours. Traders want to know whether it can bounce toward the upper channel line or slide toward lower support.
$SPX now trades near $0.358. $SPX6900 is a meme coin that takes its name from the S&P 500 index.
According to CoinGecko, the SPX6900 price today is $0.358, within a 24-hour range of $0.3446 to $0.3684. $SPX ranks 125th by market capitalization at about $333.5 million.
Live SPX6900 Market Data
Metric | Value |
Price | $0.358 |
24h Change | -2.1% |
24h Range | $0.3446 to $0.3684 |
Market Cap | $333.519M |
Market Rank | #125 |
Source: CoinGecko, as of November 3, 2026.
Technical Analysis
This SPX6900 price prediction 2026 reads the daily $SPX chart on TradingView. Price moves inside a descending channel that formed after the early-September high.
Both trendlines slope down. The channel has produced lower highs and lower lows, which keeps the broader structure bearish while price stays inside it.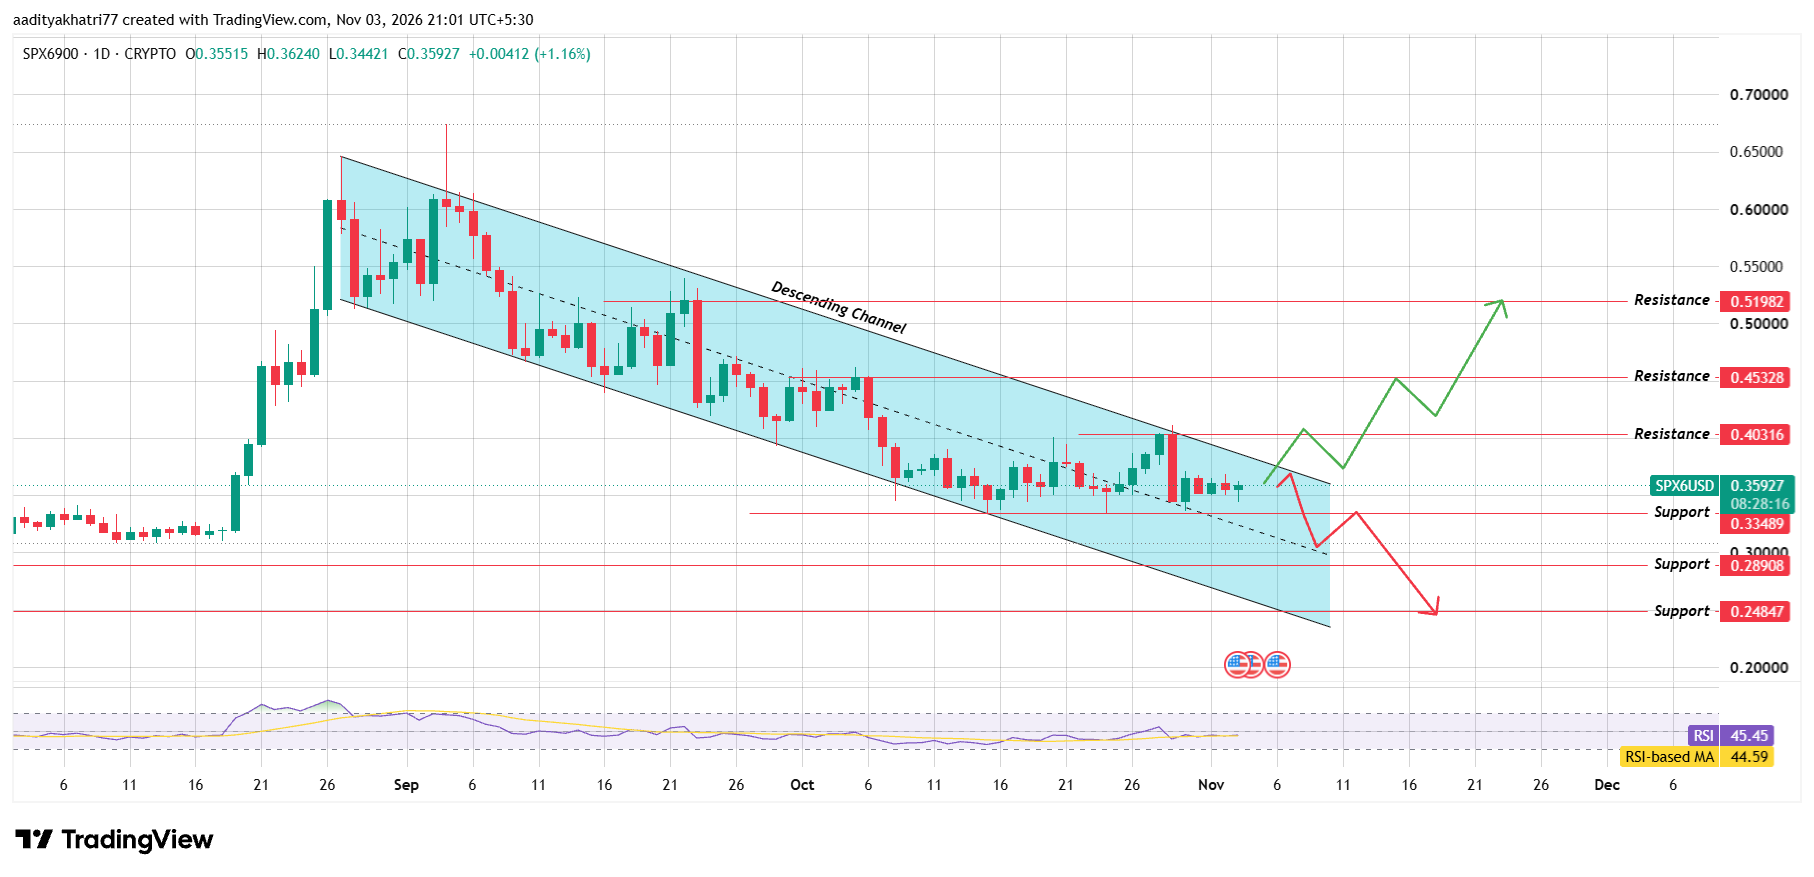
Source: TradingView, SPX6900 1D, as of November 3, 2026.
The latest daily candle opened at $0.35515, ranged from $0.34421 to $0.36240, and traded near $0.35927, a gain of about 1.16%.
Price is sitting near the middle of the channel, below the $0.40316 resistance and above the $0.33489 support.
The daily RSI reads 45.45, just above its moving average of 44.59. An RSI below 50 shows sellers still hold the momentum, but the small lead over its average hints that selling pressure is easing.
Can $SPX Bounce and Break $0.40316?
The bullish case starts with a hold. $SPX needs to defend the $0.33489 support and move back toward the upper channel line.
The next step is a daily close above the upper channel boundary, which sits close to the $0.40316 resistance. That level is about 13% above the current price.
A breakout above that zone would open $0.45328. If buyers keep control above it, the next target is $0.51982, about 45% above current levels.
Closes should come with rising volume. A channel can also reject price at the upper line, so confirmation matters.
What Happens If $SPX Loses Support?
The bearish case begins with a rejection near the upper channel line or a slide through the $0.33489 support.
A daily close below $0.33489 would show the bounce has failed. That would keep the series of lower highs and lower lows in place.
In that case, $0.28908 is the first downside target, about 19% below current levels, and it sits close to the lower channel line. If that gives way, $0.24847 follows, roughly 31% below the current price.
A brief wick under support is not enough. If price closes back above $0.33489 within a day or two, the move may prove a false break.
Price Levels to Watch
Support | Resistance |
$0.33489 | $0.40316 |
$0.28908 | $0.45328 |
$0.24847 | $0.51982 |
Bull, Base, and Bear Scenarios for SPX6900 Price Prediction
Scenario | Setup | Level |
Bull | $SPX defends $0.33489, then a daily candle closes above the upper channel line and $0.40316 on rising volume. | $0.45328, then $0.51982 |
Base | $SPX keeps moving inside the channel, with no daily close outside $0.33489 or the upper channel line. | Between $0.33489 and $0.40316 |
Bear | Support at $0.33489 gives way, and a daily candle closes below it. | $0.28908 first, then $0.24847 |
SPX6900 vs Bitcoin
Any SPX6900 price prediction outlook should check how $SPX trades against Bitcoin and Ether. Over the last 24 hours, $SPX is down 2.1% in dollars, down 1.5% against Bitcoin, and down 1.9% against Ether.
Those figures imply Bitcoin slipped about 0.6% and Ether about 0.2% in dollar terms.
$SPX therefore lagged both, so the market has not yet shown relative strength in the coin today.
Methodology
This $SPX6900 price prediction draws on two inputs. Market data comes from CoinGecko and was taken on November 3, 2026.
The chart is a daily SPX6900 view in TradingView, with timestamps in UTC+5:30.
Support and resistance levels were read directly from the chart. The channel trendlines carry no price labels, so where they cross current price is approximate.
CoinGecko uses a rolling 24-hour window, so its 2.1% decline differs from the 1.16% gain shown on the daily candle, which was still open at the time of writing.
Trading volume, wallet data, exchange flow data, and news were not part of this review, and the scenarios carry no assigned probabilities.
Expert Opinion
A descending channel with lower highs and lower lows keeps the bias with sellers until price closes above the upper line. A price sitting near the middle of the channel gives neither side a clear edge.
The setup matters more if the daily RSI climbs back above 50 and volume rises on a move toward $0.40316. In the short term, the $0.33489 level and the upper channel line will show how the market reads it.
Disclaimer: This article is for information only and is not financial advice. SPX is a highly volatile meme coin. Price can fall below $0.24847 if support fails or if broader market conditions weaken. No scenario here carries a stated probability, and a confirmed breakout can still reverse. Readers should do their own research and size any position to a loss they can accept.