Why Is Bitcoin Price Crashing Today? US Stocks Trigger Crypto Sell-Off


Bitcoin dropped below $76,000 as the Nasdaq fell 5% on AI stock fears. See key support and resistance levels, ETF outflows, and what to watch next.
Bitcoin fell below $76,000 at the time of writing as US stocks opened lower. The drop erased the gains from Wednesday's post-midterm rally.
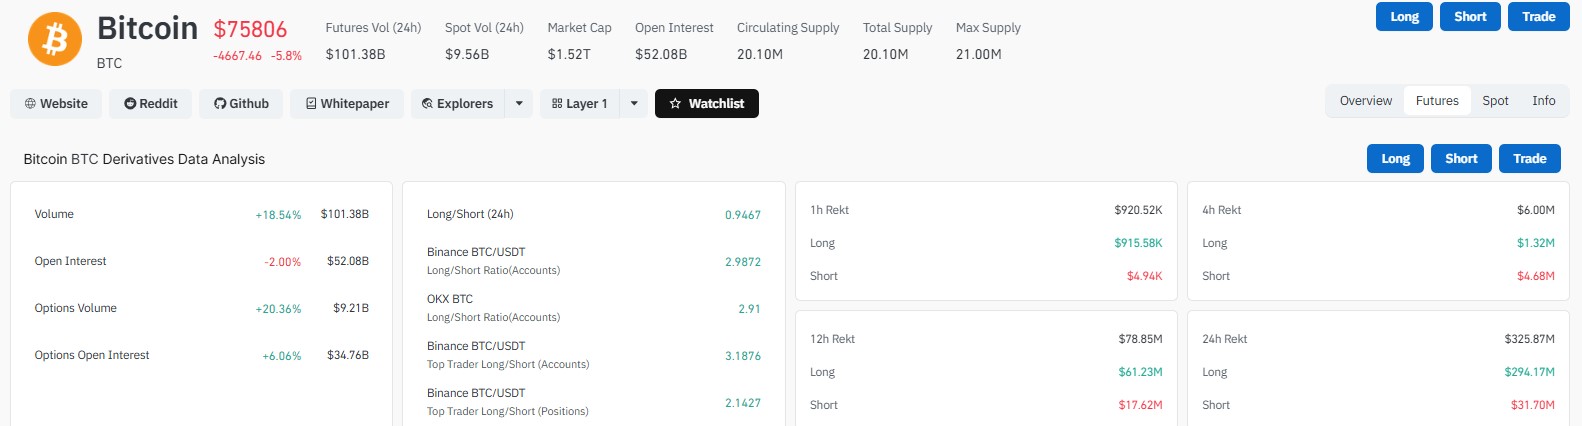
BTC now trades near $75,806, down 5.8% or $4,667.46 in 24 hours. It had climbed to about $81,100 before the reversal.
The wider crypto market lost 5% and now sits at $2.65 trillion. Ethereum, XRP and Solana fell 7% to 8%.
AI Stocks Drag Crypto Lower
The trigger came from Wall Street. The Nasdaq Composite fell as much as 5.52% at the open, and the S&P 500 dropped about 3.5%. Both have recovered a little since.
Chip stocks took the worst hit. The Semiconductor Index fell 10%, led by Nvidia, AMD and Qualcomm.
Traders link the move to the midterm results. Democrats now control the House and Senate, and investors fear tougher rules on data center construction.
Slower AI spending could cut demand for chips, power systems and cloud capacity. That worry is hitting tech first, and crypto is following.
Rep. Yassamin Ansari also posted that the new Congress should focus on pausing advanced AI development. Markets reacted to that kind of talk.
Democrats are also working on a crypto market structure bill. It could give the SEC more oversight and limit the CFTC's role.
Key Market Data
Metric | Reading |
BTC price | $75,806 |
24-hour change | -5.8% (-$4,667.46) |
Market cap | $1.52 trillion |
Futures volume (24h) | $101.38 billion |
Open interest | $52.08 billion (-2%) |
Long/short ratio (24h) | 0.9467 |
Total liquidations (24h) | $325.87 million |
Long liquidations | $294.17 million |
Short liquidations | $31.70 million |
Spot ETF daily net flow | -$325.23 million |
Spot ETF cumulative net inflow | $56.22 billion |
Liquidations and ETF Outflows
Long traders took most of the pain. They lost $294.17 million, while shorts lost $31.70 million.
One trader was liquidated eight times, for a total of 201 BTC worth about $15.6 million, according to Lookonchain.
Spot ETFs also saw selling. Fidelity's FBTC lost $199.87 million, Grayscale's GBTC lost $49.90 million, and Franklin's EZBC lost $32.92 million.
Still, cumulative net inflows stay at $56.22 billion. Total ETF net assets are $100.02 billion, or 2.33% of the market cap.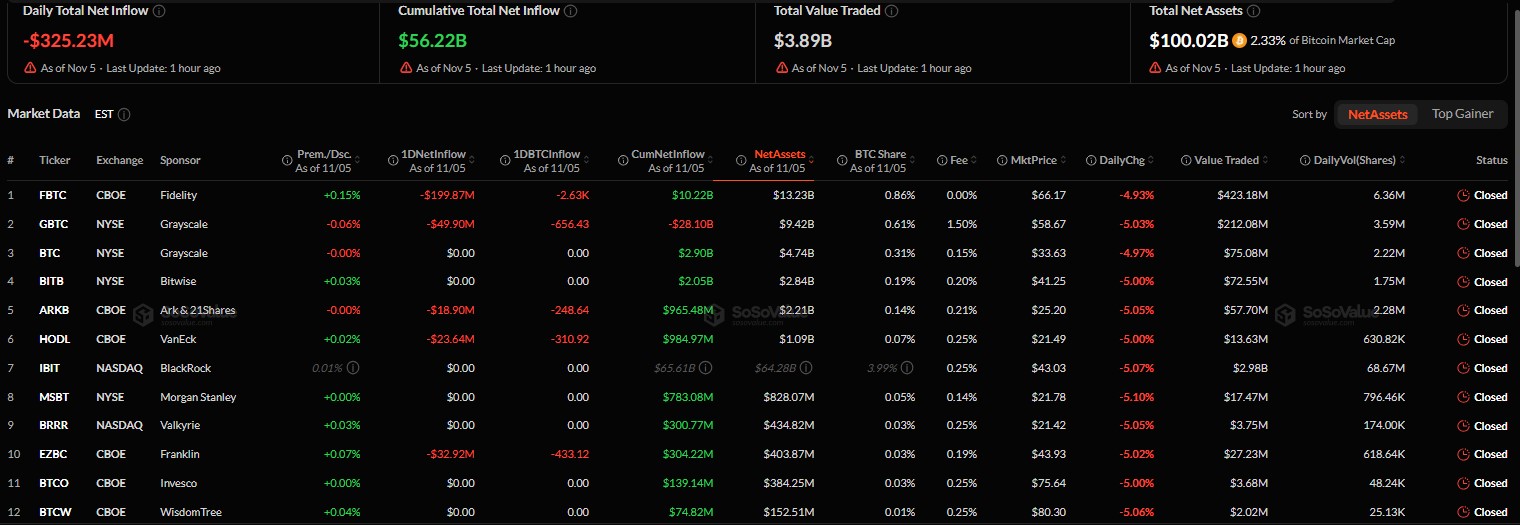
Technical Outlook: Is $75,000 Holding?
On the daily chart, BTC slipped below its 20-, 50-, 100-, and 200-day EMAs. It also broke the lower edge of a descending channel.
The RSI sits near 37.88. That points to weak momentum, but it is not oversold yet.
Level | Type | Note |
$79,000 to $80,000 | Resistance | Needed to weaken the bearish setup |
$76,500 | Resistance | Could offer short-term relief |
$76,481 | 200-day EMA | Now above price |
$74,000 to $75,000 | Support | Key zone to defend |
$72,000 | Support | Next target if $74,000 fails |
$70,000 | Support | Lower channel area |
If buyers fail to hold $74,000 to $75,000, a drop toward $72,000 and then $70,000 is possible. A move back above $76,500 may bring a short bounce.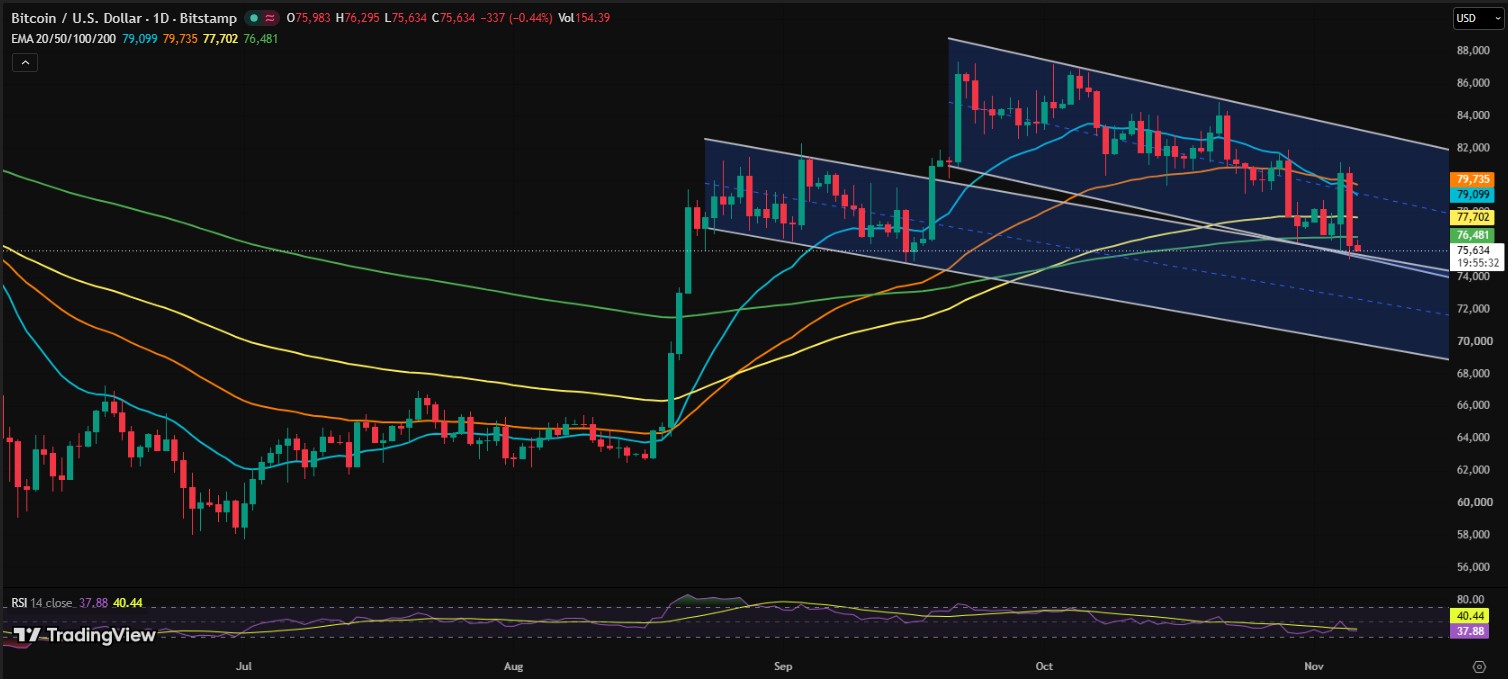
Crowd Sentiment Is Worth Watching
Santiment data shows crypto has moved against the crowd for two days in a row. Bullish talk spiked on Nov. 4, then prices fell.
Now bearish talk is far higher than bullish talk. Retail traders often panic after drops, so extreme fear can act as a counter-signal.
If fear stays high while Bitcoin steadies near $76,000, a rebound becomes more likely. Nothing is guaranteed, though.
History offers a mixed lesson. BTC fell about 23% from the 2022 midterm eve to Nov. 21, but that was during the FTX collapse. The cause is different this time.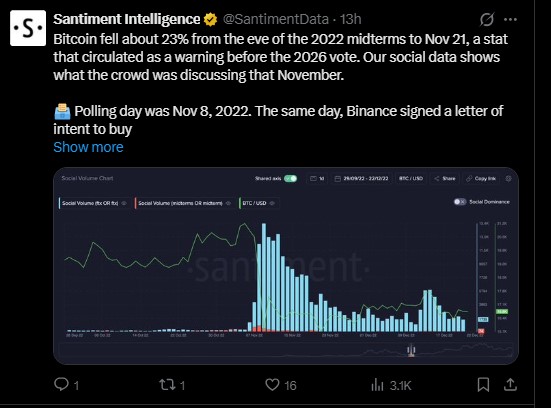
What to Watch Next
Stock moves may set the pace. If data center limits stay mostly talk, the sell-off could fade.
If real limits get approved, pressure on AI stocks and crypto could last longer. ETF flows and liquidation data will also show if sellers are tiring.
For now, the $75,000 area is the line most traders are watching.
Disclaimer
This article is for information only and is not financial advice. Cryptocurrency is volatile and carries a high risk of loss. Do your own research and speak with a licensed financial advisor before you invest.