Zcash Price Prediction: $3.68M ETF Inflows! Is a Mega ZEC Rally Next?


Zcash ETF products just logged their first daily inflow in weeks. Over $3.68M in investor capital entered the suite of spot Zcash ETFs on October 14, the first daily inflow since September 22, though not enough to turn the week positive.
The Zcash price today is trading at $1,202.52, up 10%, still inside a descending channel.
This Zcash Price Prediction looks at the inflow news, the latest liquidation data, and what the chart's own channel setup says next.
Zcash News Today: ETF Products See First Daily Inflow
A post on X reports that Zcash's suite of spot ETF products saw their first daily inflow since September 22, pulling in $3.68M in investor capital on October 14.
The post notes that figure isn't enough to put the products in the green for the week, and they would need strong inflows on Thursday and Friday to avoid a third straight week of net outflows. 
Source: Data From X
This is one account's read of fund flow data, and CoinGabbar could not independently verify the exact figures beyond what was shared.
Why is Zcash price up today?
The Zcash price today is up 10% to $1,202.52 in 24 hours, sharply outperforming a modestly rising broader market, primarily driven by a rebound from oversold conditions and renewed leveraged positioning.
Primary reason: Renewed leveraged buying after a sharp drop, indicated by a spike in derivatives funding rates.
Secondary reasons: Outperformance versus Bitcoin (beta) and a technical bounce from the $1,100 support level.
Zcash News: ZEC Liquidations Stay Short-Heavy
Window | Total Liquidated | Long | Short |
12h | $6.11M | $1.65M | $4.47M |
24h | $13.32M | $4.72M | $8.60M |
Source: Data From CoinGlass
Shorts took the larger share of liquidations in both windows, roughly 65% of the 24-hour total.
That's somewhat unusual given today's price decline, since a falling price typically squeezes longs rather than shorts, and may reflect traders who bet on further downside getting caught by brief bounces inside the channel.
What are people saying about ZEC?
Zcash chatter is a tug-of-war between ETF-fueled optimism and technical caution after its explosive rally. Here’s what’s trending:
Analysts debate whether strong ETF inflows signal lasting institutional demand or a temporary hype cycle.
Traders are closely watching key support near $1,100 to gauge if the recent pullback is healthy or the start of a deeper correction.
The community is balancing excitement over real-world utility growth with concerns over high volatility and leverage.
Zcash Technical Analysis: ZEC Outlook
ZEC is trading at $1,202.52, up 10% on a candle that opened at $1,219.84 and ranged between $1,186.83 and $1,237.86.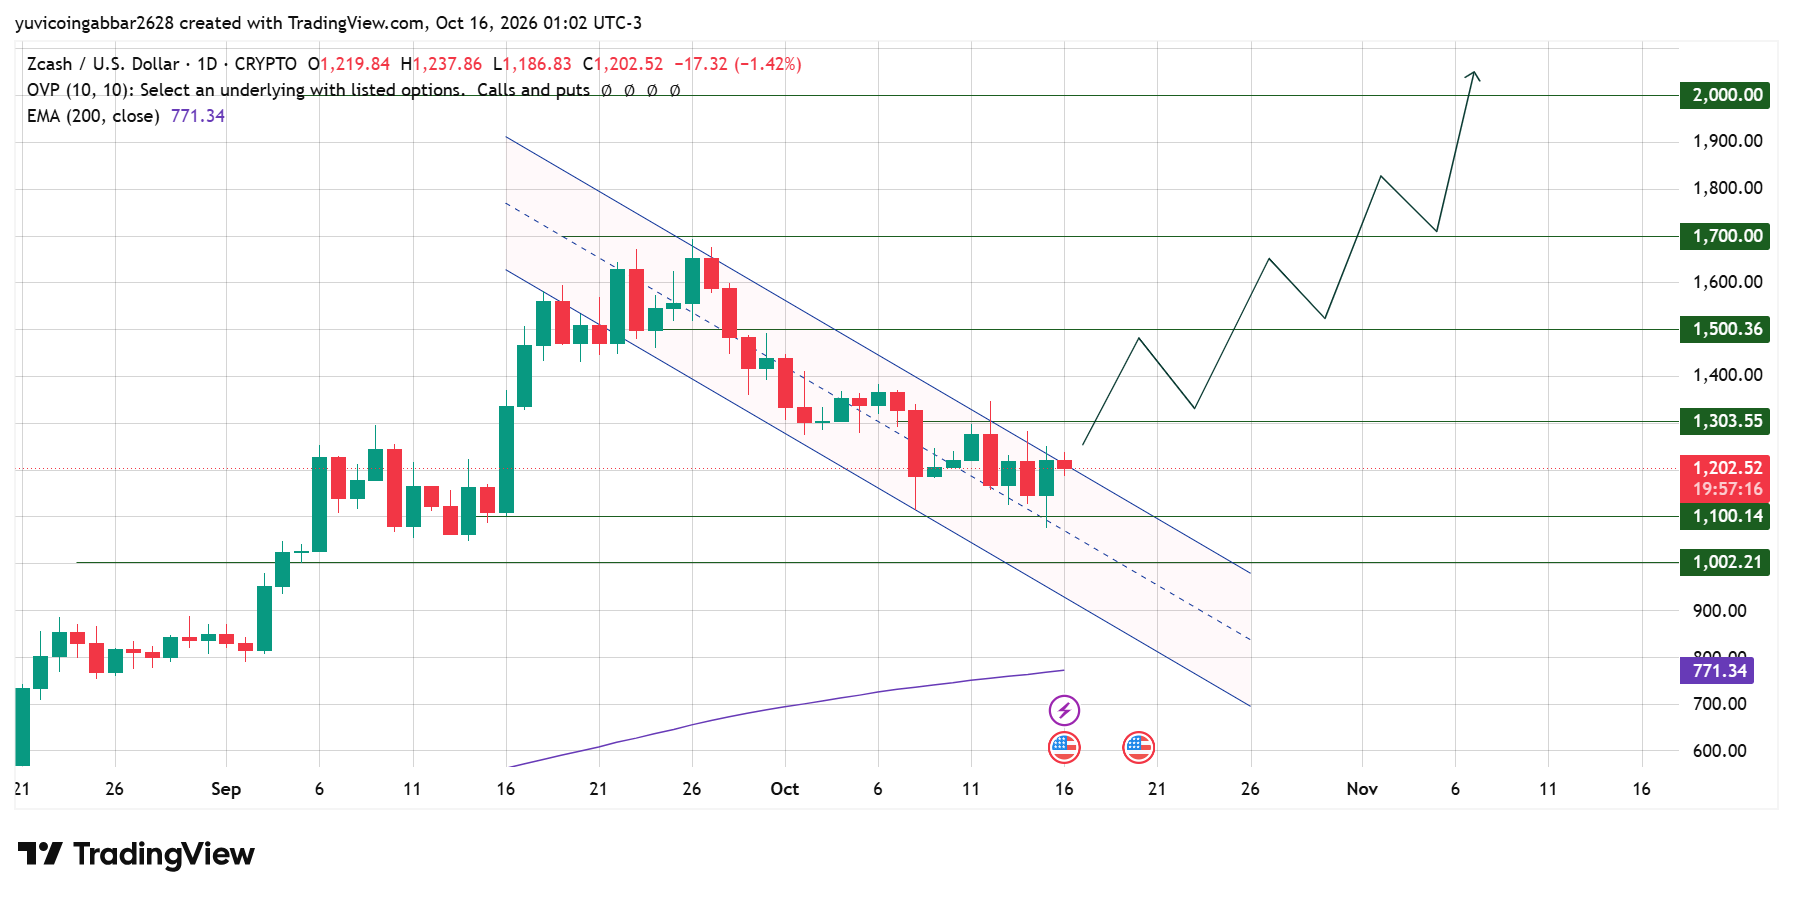
Price has been sliding inside a descending channel, a pattern formed by two parallel downward-sloping trendlines marking lower highs and lower lows, since mid-September.
If ZEC breaks above the channel's upper boundary, the chart's projected path shows a climb toward $1,303.55, then $1,500.36, and further out, $1,700.00 and $2,000.00, unfolding over several weeks.
A slide below $1,100.14 would suggest the channel is extending instead, with $1,002.21 as the next level down.
ZEC Price Scenarios: Bull, Base, and Bear Case
Bull case: A daily close above the channel's upper boundary near $1,237.86 would suggest the ETF inflow news is translating into real buying pressure, opening a path toward $1,303.55.
Base case: ZEC continues sliding inside the channel between roughly $1,100 and $1,240 while the market waits to see if inflows continue into Thursday and Friday.
Bear case: A daily close below $1,100.14 would extend the channel breakdown, with $1,002.21 as the next level.
Support
$1,100.14 is the nearer support; $1,002.21 is the deeper level below it.
Resistance
The channel's upper boundary near $1,237.86 is the first hurdle, followed by $1,303.55, then $1,500.36, $1,700.00, and $2,000.00.
Zcash Forecast: Triggers and Invalidation
Scenario | Trigger | Likely Outcome | Invalidation |
Channel breaks up | Close above $1,237.86 | Push toward $1,303.55 | Close below $1,100.14 |
Channel holds | Range between $1,100 and $1,240 | Continued consolidation | Break below $1,100.14 |
Channel breaks down | Close below $1,100.14 | Slide toward $1,002.21 | Reclaim $1,100.14 |
Zcash Price Prediction: Can ZEC Reach $2,000?
Not immediately. ZEC is still trading inside a descending channel, and reaching $2,000 would require clearing the channel's upper boundary first, then $1,303.55, $1,500.36, and $1,700.00 in sequence, a multi-stage move built around weeks or months.
The ETF inflow reported for October 14 is a modest, single-day figure that hasn't yet reversed the broader weekly outflow trend, so it isn't a factor the current chart setup already reflects.
Zcash Price Prediction 2026: Expert Analysis
According to CoinGabbar analysts, today's decline keeps ZEC inside the same descending channel it's been in since mid-September.
The ETF inflow is a mildly encouraging data point, but one day of inflows after weeks of outflows isn't enough to call a trend change.
$1,100.14 is the level that would need to hold for the channel to look like it's nearing an end rather than continuing. This read is based on the daily chart levels above.
Disclaimer
This article is for informational purposes only and isn't financial advice. Crypto markets are volatile. Always do your own research before making any trading decisions involving ZEC.
















