Zcash Price Prediction: Whale Eye ZEC! Is $2,000 the Next Target 2026?

Zcash is climbing while Bitcoin barely moves, and traders want to know why. A tracker summary points to the NU7 upgrade date. Nobody can prove that is the cause.
This Zcash price prediction checks that story against liquidation data, then reads the daily chart, where the price has broken out of a downtrend.
Market data checked on October 22, 2026, at 09:37 IST.
Zcash Price Prediction Today: Market Overview
Metric | Value |
$1,296.65 | |
24h Change (CoinMarketCap) | +2.82% |
Market Cap (CoinMarketCap) | $21.92B |
Zcash News Today: Why Is ZEC Up? NU7 Date Set
Zcash's official X account posted that the Network Upgrade 7 (NU7) mainnet activation height is being set for Block 3,543,405, around November 5, 2026. Mainnet is the live network, and the activation height is the block where the upgrade switches on.
The ZEC beat Bitcoin, which rose 0.26%, and names NU7, a short squeeze and a positive ETF flow shift as drivers. CoinGabbar could not verify the ETF flow claim.
ZEC Price Outlook: A $10,000 Call Spreads on X
A Zcash price prediction of $10,000+ comes from a post on X telling holders to "be more bullish." It offers no data or timeline. The target is about 7.7 times today's price, so it reads as opinion.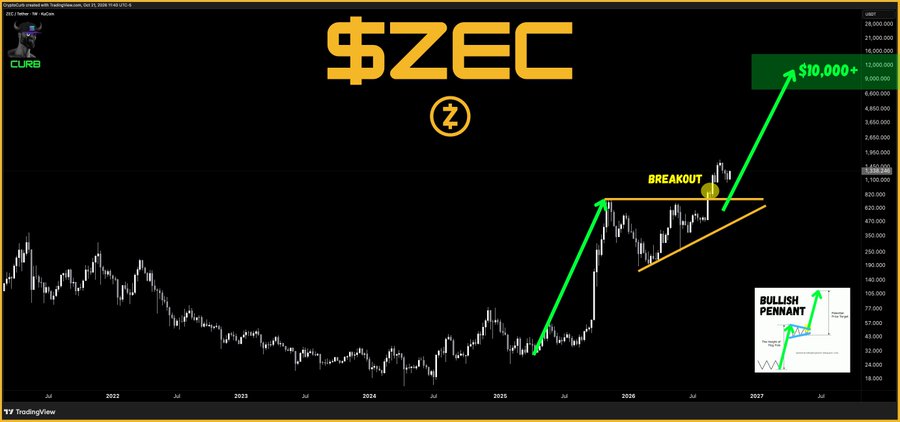
Source: Data From X
ZEC News: ZEC Liquidation and Futures Volume
A liquidation is a leveraged trade that an exchange force-closes after losses grow too large. Longs bet on a rise, and shorts bet on a fall. A short squeeze happens when forced short closures push the price higher. Coinglass shows:
Window | Total Liquidated | Long | Short |
1h | $162.69K | $154.68K | $8.01K |
4h | $1.52M | $1.28M | $242.07K |
12h | $5.16M | $2.46M | $2.70M |
24h | $12.97M | $3.09M | $9.88M |
Source: Data From CoinGlass
Shorts took about 76% of the $12.97M liquidated over 24 hours, which fits a squeeze. The last hour flipped, with longs making up about 95% of $162.69K, matching today's pullback.
Coinglass futures volume leads with Binance at $2.24B, MEXC at $1.62B and OKX at $1.50B.
Zcash Price Prediction: ZEC Breaks Out of Its Channel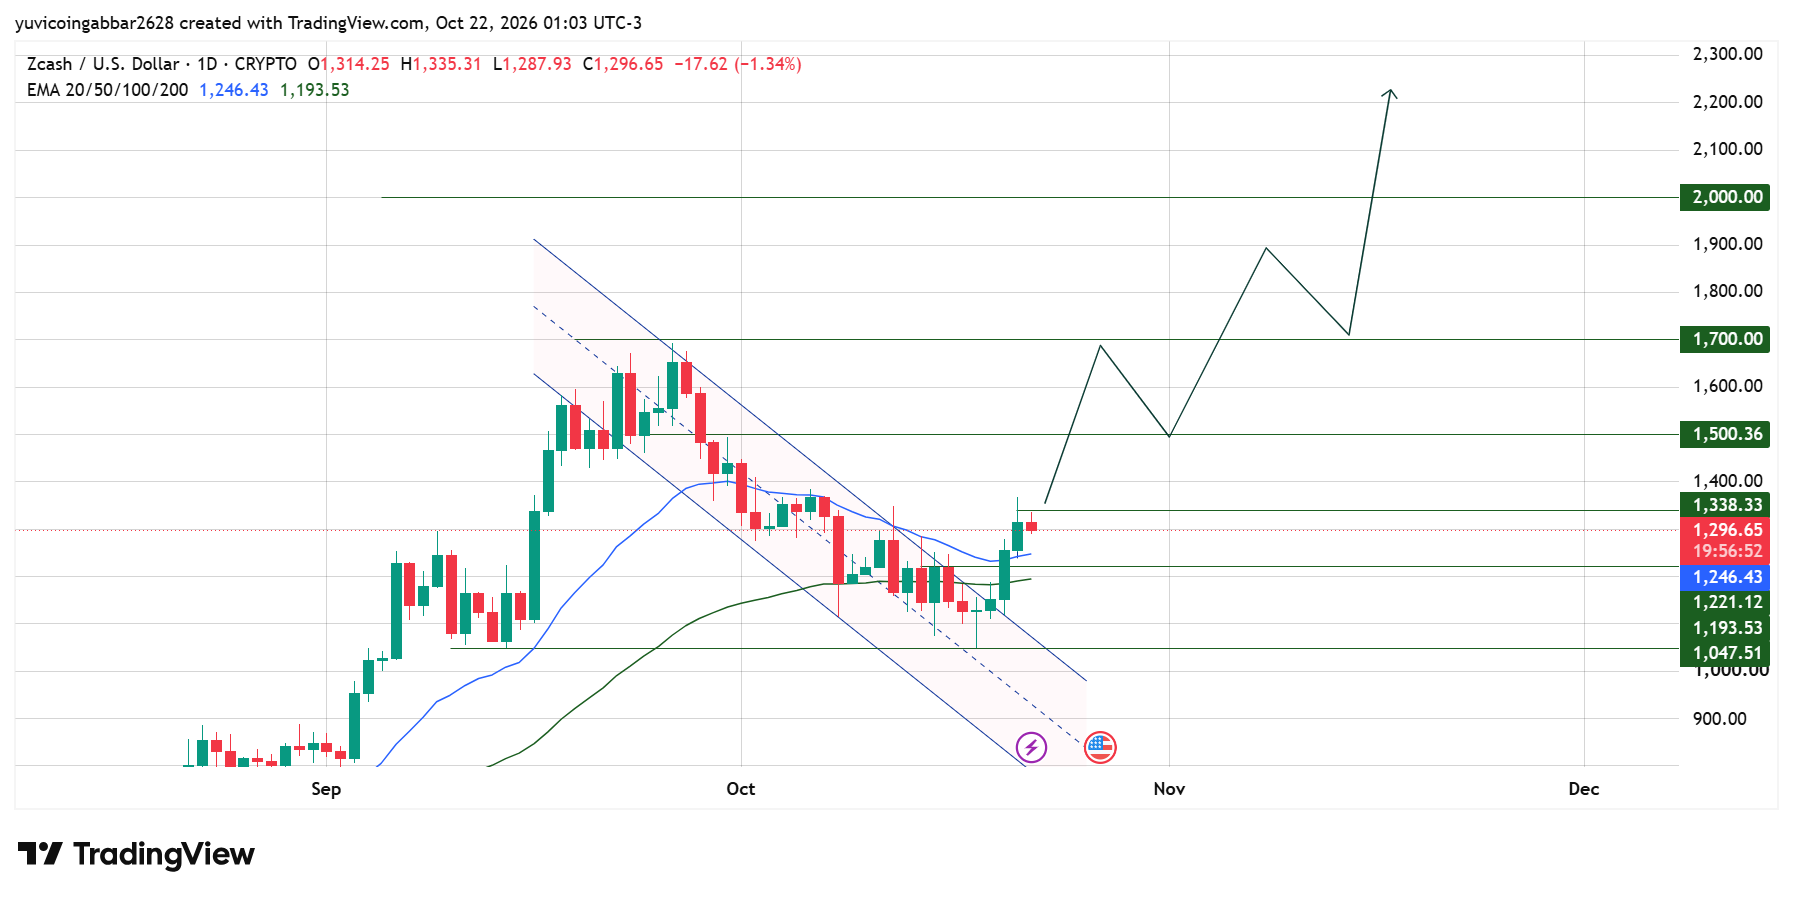
A channel is a pair of sloping trend lines that hold price inside a range. ZEC fell inside a falling channel from late September and has now broken above its upper line. The breakout needs to hold to matter.
Today's candle opened at $1,314.25, peaked at $1,335.31 just under $1,338.33 and closed the reading at $1,296.65.
The dip may be a retest, where the price returns toward a broken line or price before its next move. An EMA is a trend line that weighs recent prices more heavily, which is currently acting as a support to continue the bullish trend.
EMA | Value | Position vs Price |
EMA 20 (blue) | $1,246.43 | Below price |
EMA 50 (green) | $1,193.53 | Below price |
Zcash Forecast: Support and Resistance Levels
Type | Level |
Nearest resistance | $1,338.33 |
Higher resistance | $1,500.36 |
Further resistance | $1,700.00 |
Highest marked level | $2,000.00 |
Immediate support | $1,221.12 |
Deeper support | $1,047.51 |
Bull case: A path toward $1,500.36 opens if ZEC closes a day above $1,338.33 while holding $1,221.12 as support.
Bear case: If a daily close lands below $1,221.12, the breakout would look weak, and the price could slide toward the EMA 50 at $1,193.53, then $1,047.51.
$ZEC Scenarios and Invalidation (October 22, 2026)
Scenario | Trigger | Likely Outcome | Invalidation |
Bull | Close above $1,338.33 | Move toward $1,500.36 | Close below $1,221.12 |
Base | Range of $1,221.12 to $1,338.33 | Sideways retest | Break of either level |
Bear | Close below $1,221.12 | Slide toward $1,193.53, then $1,047.51 | Close back above $1,221.12 |
Zcash Price Prediction 2026: Can Zcash Reach $2,000?
It would take a gain of about 54% from $1,296.65, with $1,338.33, $1,500.36 and $1,700.00 to clear first. An upgrade date does not guarantee a rally.
Zcash Price Prediction: CoinGabbar Technical Read (October 22, 2026)
The main risk is a daily close below $1,221.12, which would put the breakout in doubt.
Disclaimer
This article is for informational purposes only and isn't financial advice. Crypto markets are volatile. Always do your own research before making any trading decisions involving ZEC.