BNB Price Prediction: Can CZ’s AI Payments Vision Lift BNB Past $821?


Interest in the latest BNB price prediction is growing after Changpeng Zhao said crypto could become the native currency for artificial intelligence.
The BNB coin itself is slightly lower over the last 24 hours, so the market has not yet rewarded the story.
BNB now trades near $745.36, close to the lower end of its 24-hour range. Traders are asking whether the AI payments theme can change that.
BNB launched in 2017 as the native token of Binance, which Changpeng Zhao founded. It began as an ERC-20 asset on Ethereum before moving to its own network, now called BNB Chain.
According to CoinGecko, BNB price today is $745.36, down 0.1% over 24 hours, within a range of $743.32 to $761.04. $BNB ranks fourth by market capitalization at about $98.041 billion.
The gap between its 200 million maximum supply and the 131.512 million total supply reflects token burns carried out over the years.
BNB Live Market Data
Metric | Value |
Price | $745.36 |
24h Change | -0.1% |
24h Range | $743.32 to $761.04 |
Market Cap | $98.041B |
Source: CoinGecko, as of October 29, 2026.
BNB News Today
BNB news today centers on comments from Changpeng Zhao about the link between crypto and artificial intelligence.
According to BSCN Newswire, Zhao said crypto could become the native currency for AI. He also wants the $BNB Chain to grow into a major network for AI payments.
Source: Data Taken From @BSCNWire, as of October 29, 2026.
He spoke after the opening bell ceremony for BNB Standard at Nasdaq. The remarks describe a long-term goal, and the post gave no usage figures or timeline.
For now, traders can treat the comments as a sentiment factor, not a confirmed demand driver.
Technical Analysis
This BNB price prediction October 2026 reads the daily BNB/USDT chart on Binance.
Price has stayed above a rising trendline that began at the late-August low, and the trendline now sits slightly below the $731.35 level.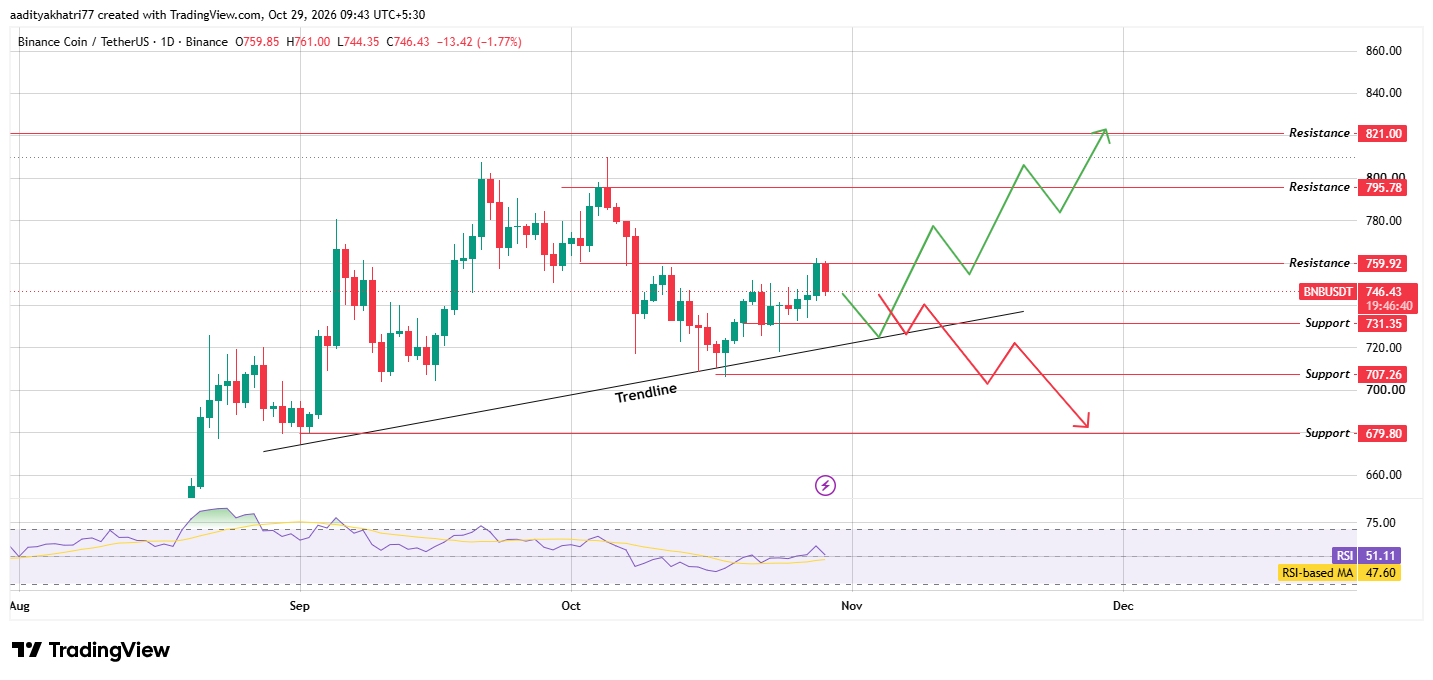
Source: TradingView, BNB/USDT 1D, Binance, UTC+5:30, as of October 29, 2026.
After peaks near $810 in late September and early October, $BNB fell close to $707.26 in mid-October and then recovered.
The latest daily candle opened at $759.85, reached $761.00 and slipped to $746.43, a decline of 1.77%. The $759.92 level has therefore held the price back so far today.
The RSI reads 51.11 against its own average of 47.60. That points to neutral momentum with a slight upward lean.
Can $BNB Bounce Off the Trendline and Break $759.92?
The bullish case needs two steps. First, $BNB should pull back toward $731.35, test the rising trendline and hold it.
A bounce from that area would show that buyers still defend the structure that has guided price since late August.
Second, $BNB needs a daily candle close above $759.92 on volume above its 20-day average. A close on weak volume would carry less weight, because the same level held price back today.
After a confirmed break, $795.78 becomes the first upside level and $821.00 the next.
Both levels sit close to the September and October peaks near $810, so sellers may return in that zone. Traders should treat the area as a place to watch the reaction, not as a guaranteed ceiling.
What Happens If $BNB Breaks the Trendline and $731.35?
The bearish case starts with a failed bounce. If $BNB slips below $731.35 and then closes a daily candle under the rising trendline, the structure that has held since August would be broken.
A daily close below both levels, backed by above-average volume, would open the way toward $707.26. That level matches the mid-October low, which is the last area where buyers stepped in.
A close below $707.26 would put $679.80 in view, near the late-August low. A single wick through the trendline is not enough. If price closes back above it within a day or two, the move may prove a false break.
Price Levels to Watch
Support | Resistance |
$731.35 | $759.92 |
$707.26 | $795.78 |
$679.80 | $821.00 |
Bull, Base, and Bear Scenarios for BNB Price Prediction
Scenario | Setup | Level |
Bull | Bounce from the trendline, then a daily close above $759.92 on above-average volume | $795.78, then $821.00 |
Base | Price stays above the trendline and moves between $731.35 and $759.92 | $731.35 to $759.92 |
Bear | Daily close below $731.35 and the rising trendline on above-average volume | $707.26, then $679.80 |
BNB vs Bitcoin
A BNB price prediction should also consider Bitcoin, because large tokens often move with the broader market.
Over the last 24 hours, $BNB is down 0.1% in dollars but up 1.4% against Bitcoin, now at 0.009336 BTC.
Together, those two figures imply that Bitcoin fell by more than $BNB in dollar terms.
That relative strength is a small positive, yet it does not remove the need for $BNB to hold $731.35 on a daily close.
If Bitcoin weakens further, the $BNB trendline will face a stronger test.
Methodology
This BNB price prediction rests on three inputs. Market data comes from CoinGecko and was taken on October 29, 2026.
Price levels and the rising trendline come from a daily BNB/USDT chart on Binance, viewed in TradingView with timestamps in UTC+5:30. The news section relies on one post from BSCN Newswire.
Every support and resistance figure was read directly from that chart, and none was extended or estimated beyond it. Breakout and breakdown conditions use daily candle closes, since an intraday wick can reverse within hours.
Exchange volume and liquidation data were not reviewed this time, so neither appears in the analysis. The scenarios describe possible paths and carry no assigned probabilities.
Expert Opinion
The remarks from Changpeng Zhao, reported by BSCN Newswire, describe a long-term vision more than a near-term price driver.
As general market commentary, narratives of this kind usually need measurable network activity before they change price direction.
For $BNB, the cleaner signal is how the market treats $731.35 over the coming sessions. A hold there would suggest buyers give the news some weight, while a daily close below it would suggest the story is not yet enough.
Disclaimer: This article is for information only and is not financial advice. BNB is volatile, and price can fall below $679.80 if the rising trendline fails and broader market conditions weaken. No scenario here carries a stated probability, and a confirmed breakout can still reverse. Readers should do their own research and size any position to a loss they can accept.


















