Midnight Price Prediction November 2026: 3 Key Levels to Watch

Is Midnight about to rise, or is this bounce trap? More traders are watching privacy coins, and Midnight is one of them.
This Midnight price prediction November 2026 follows $NIGHT, the token of the Midnight privacy chain, a blockchain built to hide transaction details. The price broke upward out of a chart pattern in late October, and the earlier Midnight forecast offers context.
NIGHT Price Today: Market Snapshot
NIGHT price today is $0.04192, up 6.8% over 24 hours, as per CoinGecko market data.
Metric | Value |
Price | $0.04192 |
24h change | +6.8% |
Market cap | $698.701M |
FDV | $1.01B |
24h volume | $18.121M |
Circulating supply | 16.607B |
Total supply | 24B |
Rank | 89 |
Source: CoinGecko, captured Oct 28, 2026, 06:20 UTC.
NIGHT Mainnet Transactions Pass 1,000,000
As per MSB Intel's X post, Midnight passed 1,000,000 NIGHT mainnet transactions. More than 334,000 landed in the past 7 days.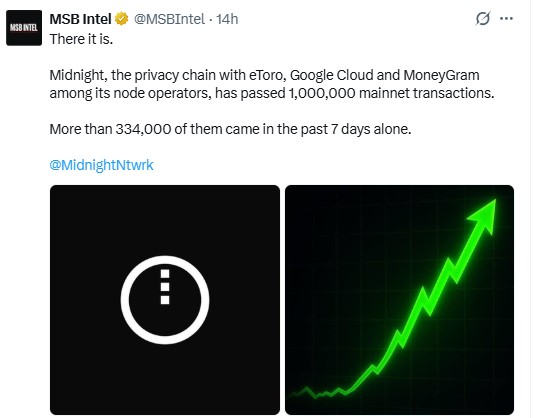
Source: MSB Intel on X, captured Oct 28, 2026, 06:20 UTC.
That 334,000 is 33.4% of all transactions so far. If the pace fades, the breakout loses its story. So why is 24-hour volume only $18.121M?
NIGHT vs Cardano: Price Correlation Check
Midnight and Cardano trade as a linked pair, so Cardano ADA is the benchmark for NIGHT moves.
Metric | NIGHT | ADA |
Price | $0.04192 | $0.2065 |
24h change | +6.8% | +1.5% |
Market cap | $698.701M | $7.758B |
Source: CoinGecko, captured October 28, 2026, 06:20 UTC.
$NIGHT gained about 4.5 times as much as ADA, and its market cap is 9.0% of Cardano's. The ADA price moved only 1.5%.
But the price cover a single day, so Cardano ADA correlation is an observed pattern, not a measured score.
NIGHT Holder Concentration on BNB Chain
$NIGHT holder concentration is extreme on the BNB Chain. The BscScan holder list shows 15,949 holders, and a holder dashboard puts 94.56% of tracked supply in the top 100 wallets.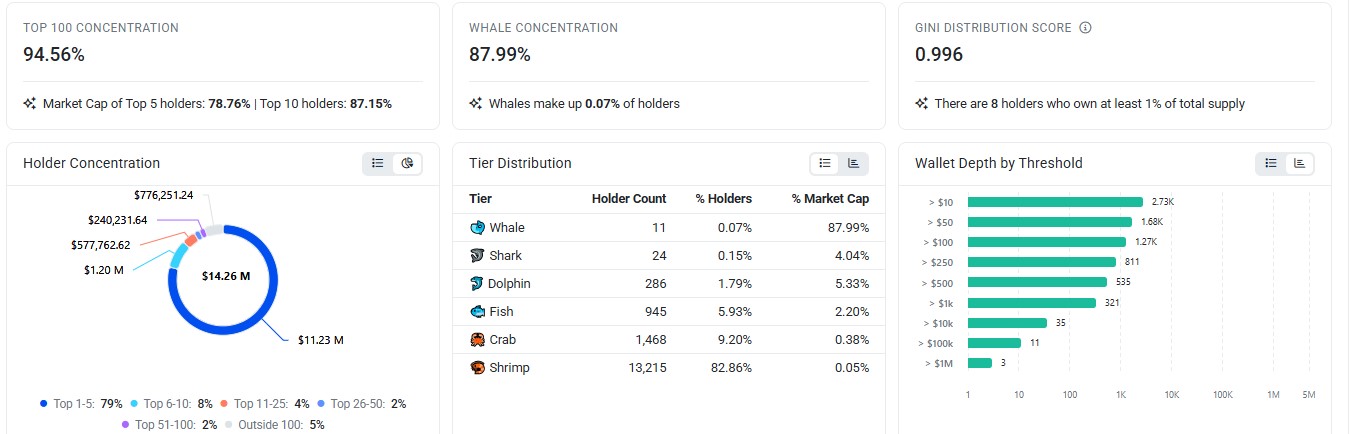
Source: BscScan, captured Oct 28, 2026, 06:20 UTC.
Whales, the biggest wallets, are just 11 holders, 0.07% of the count. Yet they own 87.99% of tracked value.
The dashboard totals $14.26M. That's 2.04% of the market cap, so the data covers BNB Chain balances only.
NIGHT Whale Wallets and Exchange Balances
$NIGHT whale wallets matter because a single transfer can move price, per the whale wallet movement guide. In the BNB Chain top 10, Binance Hot Wallet 20 holds 160,000,000 NIGHT.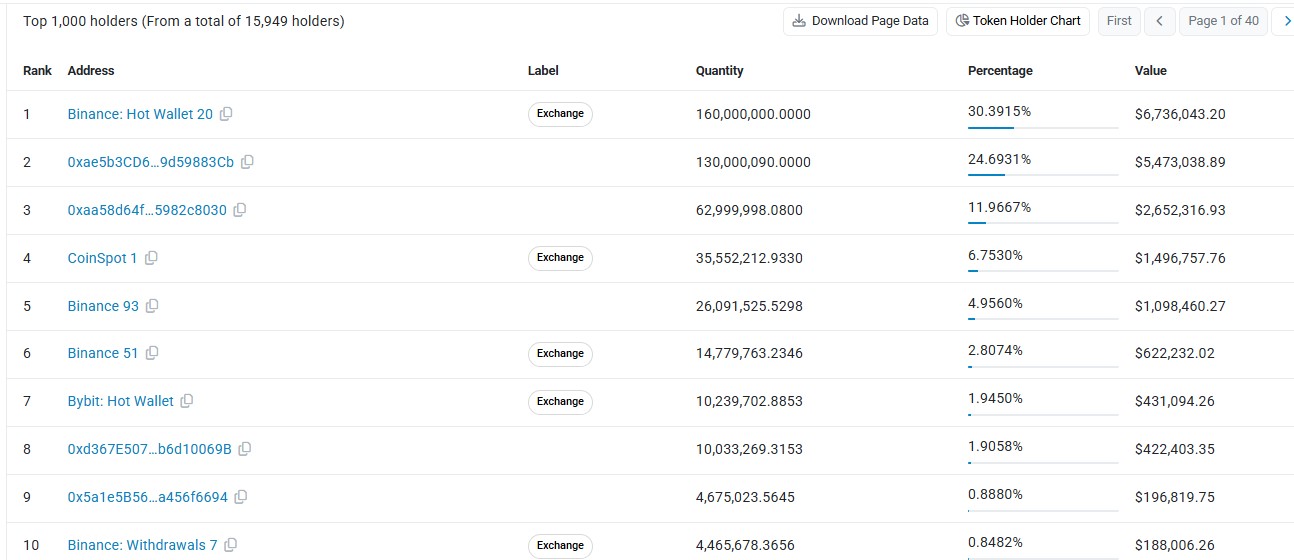
Source: BscScan, captured Oct 28, 2026, 06:20 UTC.
That wallet owns 30.3915% of the list. Binance-named wallets add up to 39.00%. And unlabeled wallets 2 and 3 hold another 36.66%.
Only three wallets hold more than $1M of $NIGHT. A hot wallet can read like a seller waiting. Actually, that's too harsh, since hot wallets mostly store user deposits.
NIGHT Open Interest and Futures Volume
Open interest is the total value of futures contracts still open. CoinGecko lists $NIGHT open interest at $33.33M, and CoinGlass NIGHT data tracks it by venue.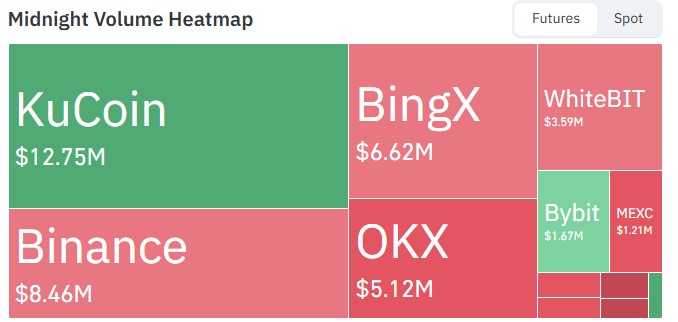
Source: CoinGlass, captured Oct 28, 2026, 06:20 UTC.
On the futures heatmap, KuCoin leads with $12.75M. Binance follows at $8.46M, a gap of $4.29M.
The 7 named venues add up to $39.42M, about 1.18 times open interest.
Midnight price prediction November 2026: Falling Wedge Chart Analysis
The 4-hour Binance chart shows a chart creating the falling wedge, a pattern of lower highs and lower lows between sloping upper and lower lines. A previous key support forecast covered the same zone as this Midnight price prediction.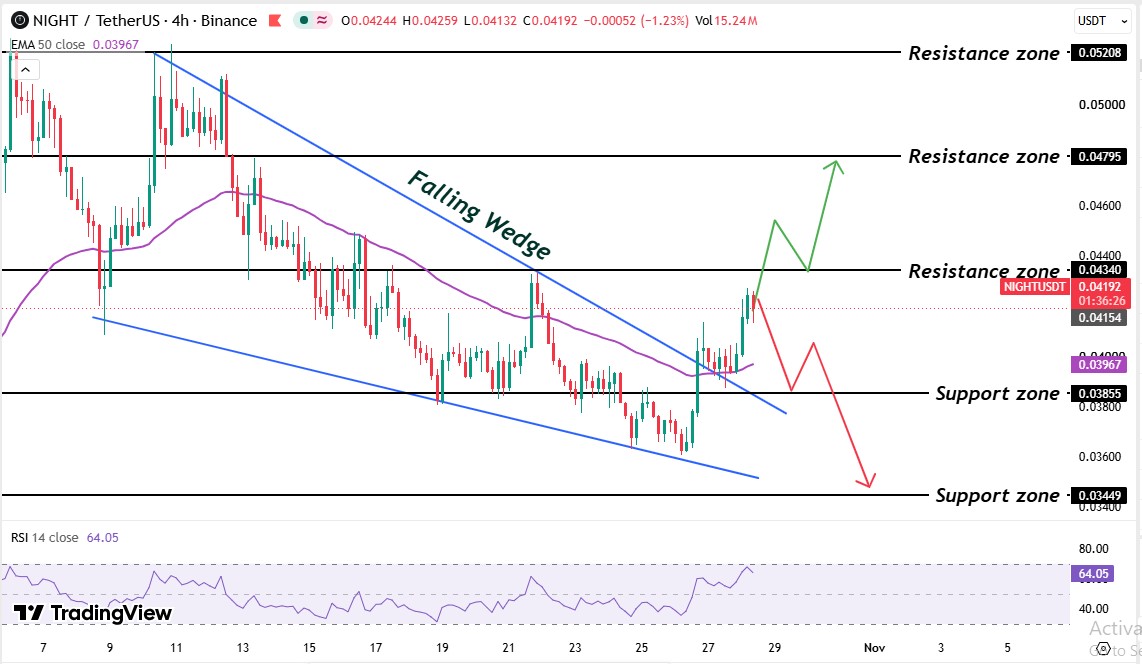
Source: TradingView, captured Oct 28, 2026, 06:20 UTC.
Price spiked near the $0.05208 level on Oct 10. After that price started making lower highs and lower lows, and that formed the wedge, and after that price was rejected by the $0.04340 level around Oct 22.
Price slid under the $0.03855 level and touched the lower wedge line around Oct 25. Buyers broke the upper line of the wedge around Oct 26, a falling wedge breakout, and started taking little pullback above the EMA.
50 EMA sits at $0.03967. Price trades right above it. Now EMA is also acting as support.
RSI reads 64.05. Not much room remains, since 70 is the overbought line.
$NIGHT 1-Day Chart: Wedge Breakout Opens Higher Levels
The daily chart shows the same falling wedge on a larger scale. Price defended the $0.03566 support and the 50 EMA at $0.03623 around Oct 25, and then a green candle on Oct 26 closed above the upper wedge line.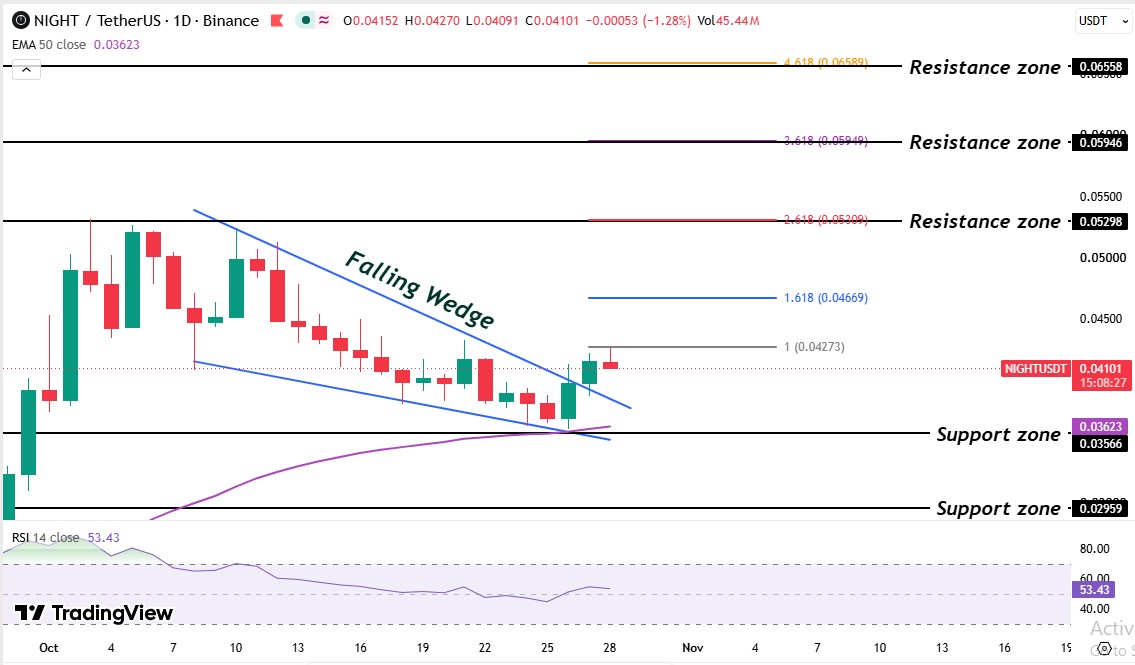
Source: TradingView, captured at 9:00 UTC on Oct 28, 2026.
The latest candle is red after a rejection near $0.04273, which is a small pullback after the breakout. Daily RSI reads 53.43, a neutral level with more room for upside than the 4-hour RSI.
NIGHT Key Levels: 4-Hour and 1-Day Timeframe
Timeframe | Resistance Levels | Support Levels |
4-Hour | $0.04340, $0.04795, $0.05208 | $0.03855, $0.03449 |
1-Day | $0.05298, $0.05946, $0.06558 | $0.03566, $0.02959 |
NIGHT Short-Term Price Levels
Level | Fibonacci Extension | Type |
$0.04273 | 1.0 | First Level |
$0.04669 | 1.618 | Second Level |
$0.03566 | 50 EMA zone | Support and invalidation |
NIGHT Long-Term Price Levels
Level | Fibonacci Extension | Type |
$0.05298 | 2.618 | First Level |
$0.05946 | 3.618 | Second Level |
$0.06558 | 4.618 | Higher Level |
$0.02959 | Major support | Deeper support |
A daily close above $0.04273 opens the way toward $0.04669, while $0.05298 is the main long-term test since it is also the October high. A daily close below $0.03566 would weaken the breakout and may send the price toward $0.02959.
Midnight price prediction November 2026: Expert Outlook
As per CoinGabbar analysis, the setup stays bullish above $0.03967 on the 4-hour chart and above $0.03566 on the daily chart. Price broke out of the falling wedge on both timeframes and trades above the EMA 50, so the Midnight price prediction favors $0.04795 if price breaks the $0.04340 resistance.
In the short term, a daily close above $0.04273 can open the way toward $0.04669. In the long term, a break above $0.05298 is needed to aim for $0.05946 and $0.06558.
Chasing price near resistance is the weaker trade, so waiting for a daily candle above $0.04340 on volume over $18.121M gives a cleaner breakout signal. A daily close below $0.03566 would weaken the setup and may send the price toward $0.02959.
Disclaimer: This article is for information only and isn't financial advice. Crypto assets are highly volatile, and prices can move sharply in either direction. Readers should do independent research and consider their own risk tolerance before making any decision.



















