Chainlink Price Prediction: Can DTCC News Save LINK at $12.735?


Is LINK building a floor, or just catching its breath before another leg down?
That's the question behind every Chainlink price prediction today, and the wider crypto price predictions crowd is asking it too.
At $12.89, Chainlink price today sits right on the 200 EMA. DTCC news landed overnight. But the LINK price prediction still leans cautious.
Chainlink Price Prediction: What Is Happening Now?
Buyers got a headline. Sellers still own the 4-hour chart.
Current Price and 24H Performance
The $LINK price trades at $12.89, up 0.28% in 24 hours, inside a $12.72 to $13.01 range, per CoinMarketCap live data. Data time: Oct 10, 2026, 11:00 UTC.
But the week tells a different story. $LINK is down 6.60% over seven days, though it's still up 9.18% across 30 days.
Trading Volume and Market Cap
Market cap sits at $9.67B. Futures volume reads $325.87M. Against just $48.78M in spot, per CoinGlass derivatives data.
Meanwhile, CoinMarketCap shows 24-hour volume down 60.26% at $191.87M. Thin trading usually means weak conviction.
Why Is LINK Moving Today?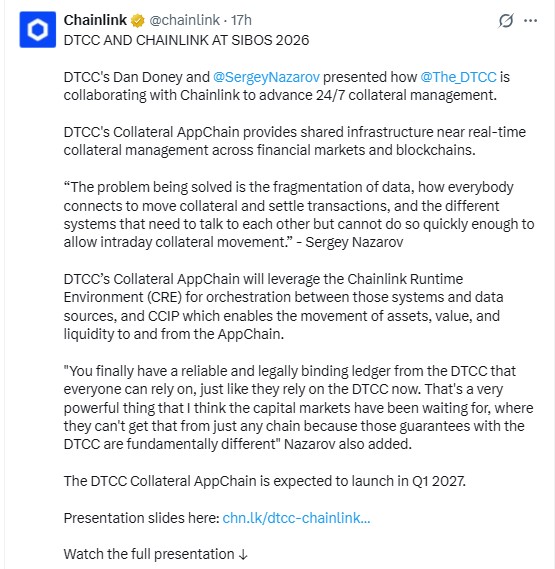
Chainlink news today centers on DTCC. Its Collateral AppChain will use the Chainlink Runtime Environment and CCIP, per Chainlink's official post.
The goal: near real-time collateral management across financial markets and blockchains. Launch window: Q1 2027. Not tomorrow. The post went live about 17 hours before Oct 10, 2026, 11:00 UTC.
What the DTCC News Means for LINK
The AppChain leans on CCIP cross-chain tools to move assets and liquidity. That's a credibility win for Chainlink.
Can a Q1 2027 launch really move a chart stuck under every major EMA today? Buyers need a reason now.
Spot LINK ETF Flows
Daily Inflows
US spot $LINK ETF products pulled in $9.48M on Oct 9, 2026, their first inflow after five flat sessions, per the SoSoValue ETF tracker.
That sounds bullish. On second thought, $9.48M is tiny against a $9.67B market cap. Still, it beats every other day since Sep 24.
Grayscale vs Bitwise
Grayscale's GLNK took all $9.48M, while Bitwise's CLNK saw $0, extending the story from earlier LINK ETF inflow coverage.
Total net assets reached $225.35M, about 2.35% of LINK's market cap, up from $211.70M a day earlier.
Circulating Supply and Staking
Circulating supply is 748.09M of a 1B maximum, and the Community Staking Pool alone holds 40.88M LINK, as covered in LINK staking updates.
That leaves 251.91M outside circulation. Five non-circulating wallets hold 30M each.
Holder Data
Holder Count
Etherscan lists 914,659 LINK holders. Past wallet count coverage tracked non-empty wallets falling. A big holder base hasn't stopped a 6.60% weekly slide.
Whale Concentration
Whales, meaning very large wallets, are only 0.47% of holders yet control 90.84% of market cap, per Etherscan holder data.
The top 100 wallets hold 61.62%. Binance 28 alone holds 4.22% of supply. One heavy seller can move this chart.
Derivatives Positioning
Binance's LINK/USDT long/short ratio reads 1.5988, while OKX shows 2.6. Longs outnumber shorts on both.
Liquidations, meaning forced exits from margin trades, hit $145.78K in 24 hours. Shorts took the heavier share at $87.31K.
Bitcoin and Ethereum Backdrop
Bitcoin trades at $82,781.20, up 0.33%. Ethereum sits at $2,493.84, up 0.12%, per CoinMarketCap on Oct 10, 2026, 11:00 UTC.
Volume cooled everywhere. Bitcoin's 24-hour volume fell 49.89% to $20.77B, and Ethereum's dropped 64.56% to $6.58B.
LINK Technical Analysis: Descending Channel on the 4-Hour Chart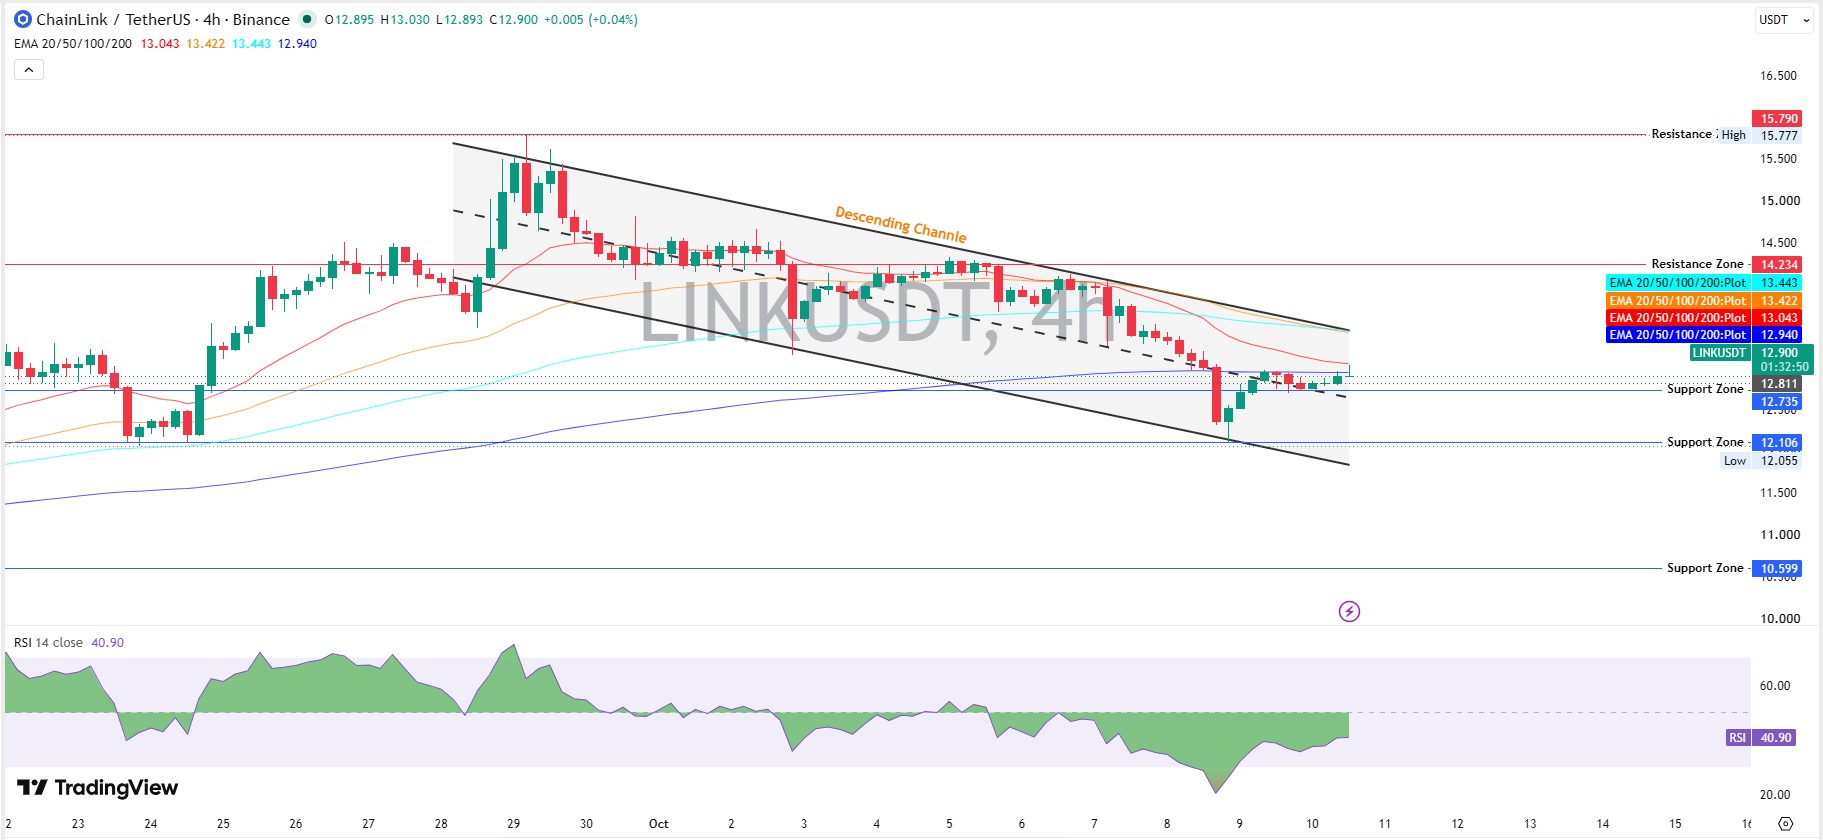
$LINK technical analysis starts with the TradingView 4-hour chart, where LINK/USDT on Binance trades inside a descending channel.
A descending channel means lower highs and lower lows. The price bounced from $12.055 and trades at $12.900 now, near the channel's midline.
Lower highs since $15.777 remain intact. Plainly bearish, for now. RSI reads 40.90. EMA, a moving average that weights recent trades more, sits at $13.043 (20EMA), $13.422 (50EMA), $13.443 (100EMA), and $12.940 (200EMA). Price trades just under all four. Which means every bounce meets overhead sellers.
Key Support Levels
First support sits at $12.735. Next comes $12.106, beside the recent $12.055 low, then $10.599. A slide to $10.599 would mean roughly 17.8% downside from $12.89.
Key Resistance Levels
First hurdle: the $13.043 to $13.443 EMA cluster. Then $14.234, and the $15.790 ceiling.
$14.234 sits about 10.4% above $12.89, so can $LINK reach $14.234? It depends on volume first. And $LINK support and resistance both hinge on that.
Chainlink Price Prediction October 2026
This Chainlink price forecast stays conditional, and the monthly price outlook tracks the same levels.
Bull Case
If $LINK reclaims the $13.443 EMA on rising volume, $14.234 could open within two weeks. A $LINK price target of $15.790 needs that first. Trading under $12.735 would weaken the idea.
Base Case
Chop between $12.106 and $13.443 over seven days is the base case if volume stays thin.
Bear Case
Trading below $12.106 could open $10.599 within two weeks. A reclaim of $13.043 would cancel that.
What Could Change the Outlook
Institutional headlines like the earlier Open USD oracle report keep Chainlink in the conversation, though price hasn't followed yet.
Steady ETF inflows plus an EMA reclaim would soften the bearish read. And a fresh DTCC update could add fuel.
Risks to the Chainlink Price Prediction
Market Risk
Altcoins usually follow the majors, so a weak Bitcoin price prediction backdrop could drag $LINK lower.
Sentiment Risk
Risk appetite can rotate fast, and meme coin market news often shows where speculative money goes first. A rotation away from large altcoins would pressure $12.735.
Final Takeaway
This Chainlink price prediction stays bearish short-term, with $12.106 as the line to defend. A reclaim of $13.443 changes that. Sector shifts, including AI crypto news, can swing sentiment fast. Timing matters here.
Disclaimer: This article is for educational market analysis only and isn't financial advice. Crypto assets are highly volatile, and readers should research independently before trading.

















