Chainlink Price Prediction: Can LINK Hold $11.95 After Hot CPI?


Did one inflation report just erase a week of Chainlink gains?
LINK price today is $12.07, down 7.11% in 24 hours after hot U.S. inflation data hit risk assets. This Chainlink price prediction picks up from yesterday's Chainlink forecast, where $12.372 was the line to defend.
That level broke. Now $11.95 carries the weight.
Chainlink Price Prediction: What Is Happening Now?
Current Price and 24H Performance
LINK trades at $12.07, down 7.11% in 24 hours, per CoinMarketCap live data. Data time: Oct 15, 2026, 03:30 UTC. The 24-hour range ran from $12.02 to $13.06. And the 7-day slide reads 9.24%.
Trading Volume and Market Cap
Volume jumped 26.26% to $362.66M. Which means sellers showed up in force.
Market cap slipped to $9.03B at rank #13, with 748.09M of 1B LINK circulating. The LINK staking update covers part of what's locked.
Why Is LINK Moving Today?
Inflation data hit first. Crypto sold hard.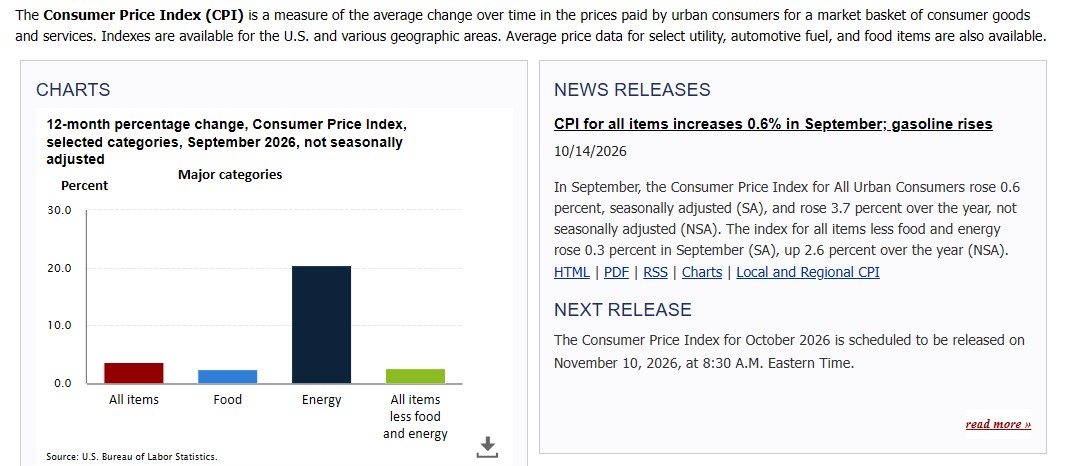
U.S. CPI landed Oct 14, 2026, at 12:30 UTC. Headline prices rose 0.6% in September, per the BLS CPI release, and core prices rose 0.3%.
Bitcoin dropped 2.91% to $81,273.21, and Ethereum fell 5.33%. No LINK-specific bad news surfaced. Not a coin problem. A macro one.
PPI data lands Oct 15, and the Fed meets Oct 27 to 28.
Yesterday's Prediction: Target vs. Actual Result
Timeframe: Oct 14, 2026, 05:00 UTC to Oct 15, 2026, 03:30 UTC. Bull target $14.027 needed a reclaim of $13.204. The high reached only $13.06. Status: Not Hit. Base range of $12.372 to $13.204 lasted about one day. Status: Not Hit.
Bear target $11.906, followed a break under $12.372. LINK broke it, then bottomed at $11.935 on Binance. Status: Partially Hit.
Yesterday's Chainlink price prediction leaned bearish, and that worked. Not even the DTCC news update lifted the chart.
Chainlink Technical Analysis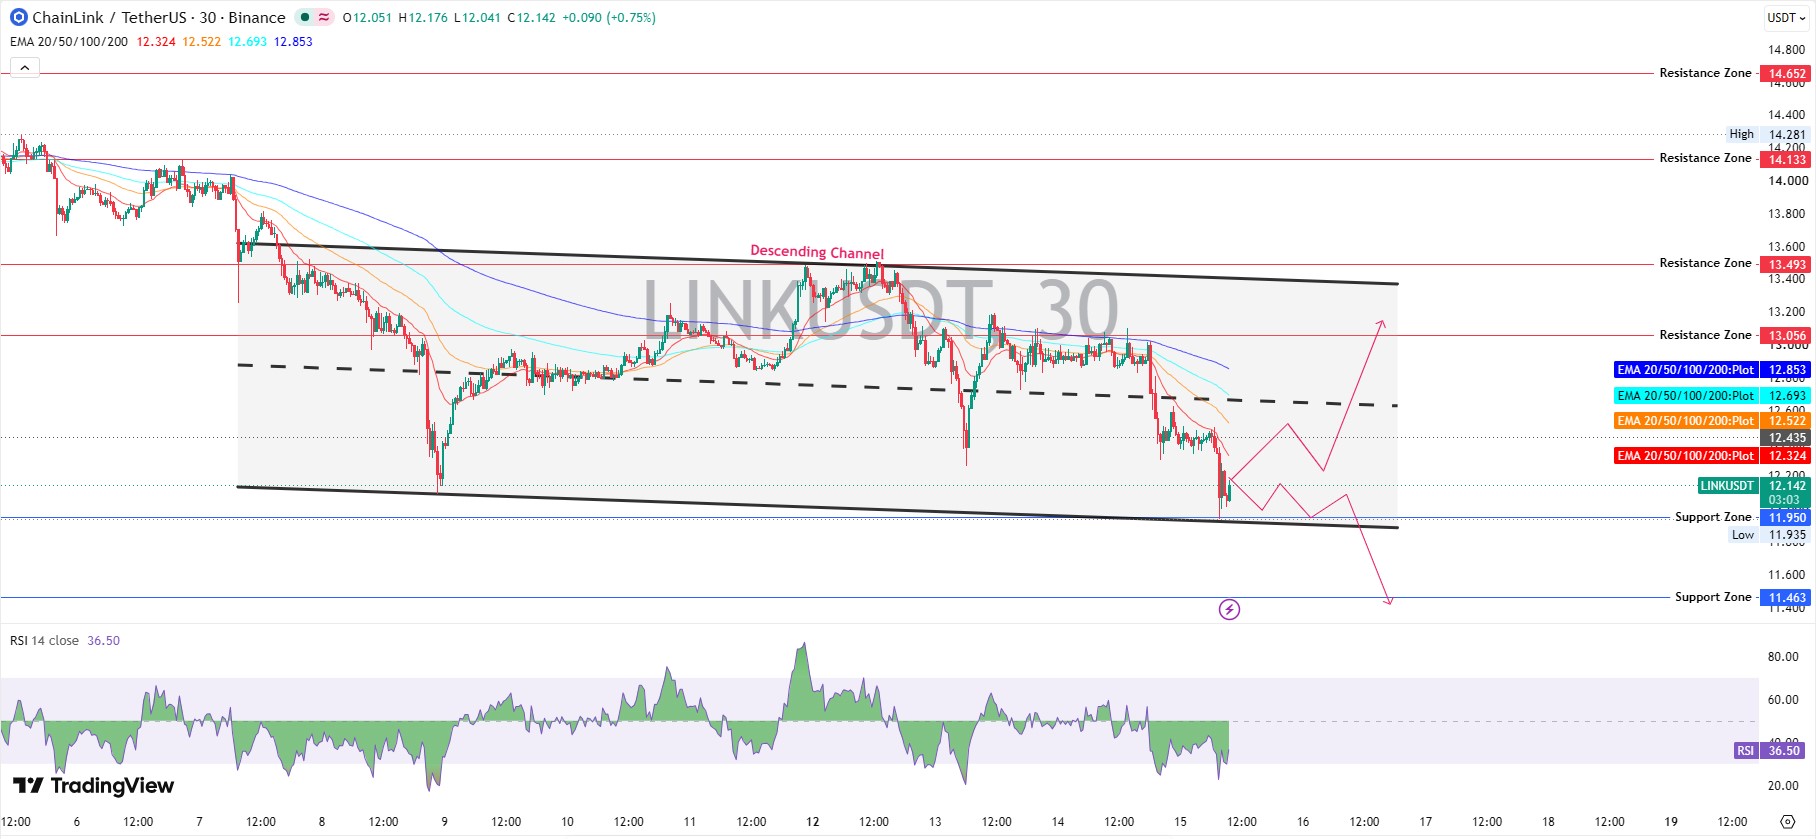
Chainlink technical analysis on the 30-minute Binance chart shows a descending channel, a path of lower highs and lower lows.
Price trades under all four EMAs. EMA means exponential moving average, a trend line that weights recent trades more heavily. The 20 EMA sits at $12.324, the 50 EMA at $12.522, the 100 EMA at $12.693, and the 200 EMA at $12.853.
RSI reads 36.50 per TradingView chart data. Weak, but not oversold. A bounce feels due. Actually, scratch that, because nothing in the data shows buyers yet.
Key Support Levels
LINK support and resistance starts at $11.95, the channel base, about 1.0% lower. Next comes $11.463, roughly 5.0% under.
That area echoes the earlier channel test. Lose it, and sellers get room.
Key Resistance Levels
First hurdle: the 20 EMA at $12.324, about 2.1% higher. Then $12.522, $12.853, and supply zones at $13.056 and $13.493.
Chainlink ETF Inflows
Daily Flow Numbers
Chainlink ETF inflows stayed at $0 on Oct 14, 2026, per SoSoValue ETF data, after another $0 on Oct 13.
Cumulative net inflow holds at $179.61M, so no outflows either. Net assets dipped to $220.47M.
Grayscale and Bitwise Funds
GLNK holds $160.24M, and CLNK holds $60.23M. Shares fell 3.94% and 3.12% on Oct 14. That record ETF inflow feels far away now.
LINK Derivatives Data
Futures volume reached $510.77M against $83.77M in spot, per CoinGlass derivatives data. Open interest, the total value of open futures contracts, fell to $557.87M from $608.46M yesterday.
Longs were crowded. Which is why $2.01M of the $2.09M liquidations, meaning forced exits, hit long bets. The OKX long/short ratio still reads 2.77. Who blinks next?
Holder Data Snapshot
Holder Count
Holders total 915,688, up from 915,516, and the LINK wallet count trend tracks the climb.
Whale Concentration
Whales, meaning very large wallets, number 4,200 per Etherscan holder data, which is 144 fewer than yesterday. They're 0.46% of holders yet control 90.74% of market cap. The top 100 wallets hold 61.43%. Concentration like that can amplify moves.
Chainlink News Today
DTCC at Sibos 2026
Chainlink news today includes DTCC digital assets chief Nadine Chakar joining Sergey Nazarov at Sibos 2026, per Chainlink's X post, posted around 17:30 UTC on Oct 14, 2026.
Tokenization at scale was the topic. But price didn't react.
Stellar Integration
Chainlink Data Feeds and Data Streams went live on Stellar around 13:30 UTC on Oct 14, 2026, per Stellar's X post.
Builders get oracle data for lending, stablecoins, and tokenized equities across a $4B+ RWA, or real-world asset, network. Both stories landed after CPI. Neither stopped the slide.
Can LINK Rally Continue?
Bullish Scenario
Reclaiming $12.522 and then $12.853 on rising volume could open a LINK price target of $13.056, about 8.2% higher, within five days. Buyers from the ETF inflows breakout would help. Trading under $11.95 cancels it.
Base Scenario
A chop between $11.95 and $12.522 may hold for two to three days.
Bearish Scenario
Trading below $11.95 could expose $11.463 within a week. If $11.95 breaks. Then sellers stay in charge.
What Could Change the Outlook
A calm PPI print could ease pressure. And CCIP, Chainlink's cross-chain messaging protocol, could lift adoption, per the CCIP vault adapters report.
Chainlink Price Prediction October 2026
Bull Case
This LINK price forecast reaches $14.133 by Oct 31, about 17.1% higher, only if $13.493 breaks first.
Base Case
A range of $11.95 to $13.056 could hold most of the month, and the October 2026 price prediction adds the wider view.
Bear Case
Trading under $11.95 could drag LINK toward $11.463, about 5.0% lower.
Risks That Could Change the Chainlink Price Prediction
Hot inflation can repeat. Zero ETF flows can turn into outflows. Adoption stories, such as Open USD news, can support sentiment. But macro pressure usually wins short-term.
Final Takeaway
This Chainlink price prediction leans bearish while LINK trades under $12.522. Holding $11.95 keeps the channel alive. But a reclaim of $12.853 would flip the bias. Timing matters.
Disclaimer: This article is for educational market analysis only and isn't financial advice. Crypto assets are highly volatile, and readers should research independently before trading.

















