Gold Price Prediction: $4K Support at Risk! Double Bottom or Crash?


Gold is trading at $4,028.09 today on the daily chart, down 0.96%. So traders will be watching whether gold can hold above the $4,000 level or slips further.
Gold is testing $4,000, about 24% below the $5,300 high cited in one post. Why is it falling, and is $4,000 the bottom? The daily chart shows two lows near $4,000 but no confirmed turn. This Gold Price Prediction covers three posts: the Fed hold and the chart.
Market data checked on October 29, 2026, at 1:31 IST.
Gold News: Why Is Gold Falling?
A post on X says gold ran to $5,300 and almost nobody noticed it round-tripping back to $4,000. After a blow-off top, a sharp final spike, earlier this year, it says spot gold has given back more than 20% and is testing $4,000.
It says the debasement trade, buying gold on fears that money printing erodes currency value, got crowded and overheated and is cooling off hard.
The post calls this a healthy correction in a bull market. It says the structural case, deficits that never shrink and a government that only knows how to print, has not changed. Its question is whether $4,000 holds. If it is lost, it says later buyers would get a better entry than those who chased $5,300.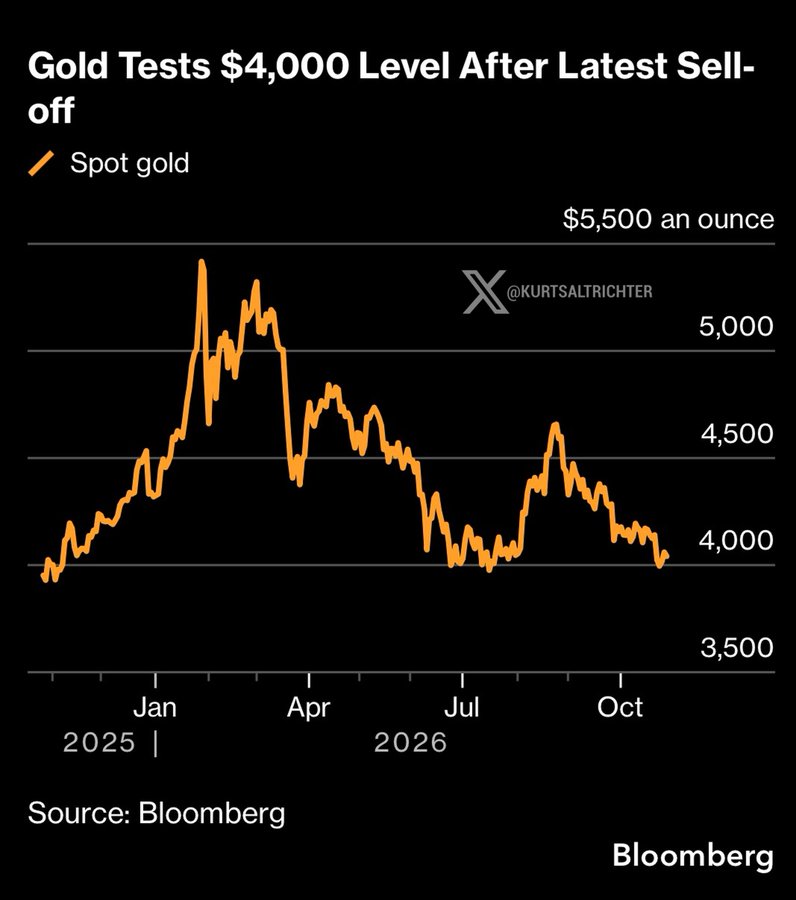
CoinGabbar could not verify these claims.
Gold Price Outlook: Is a Bottom Forming?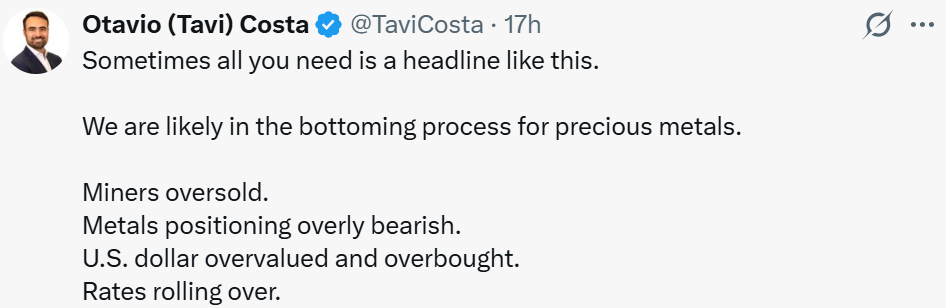
Precious metals are likely in a bottoming process. Its points: miners are oversold, metals positioning is overly bearish, the U.S. dollar is overvalued and overbought, and rates are rolling over.
It does not say which rates. The Fed raised its rate in September and held it on October 28, so CoinGabbar could not verify that point.
Source: Data From X
Gold Double Bottom: Rally to $5,000 Claim
Gold is carving a bottom after a 30% correction from its January 2026 highs. Once the double bottom is complete, it expects a sharp rally to $5,000 or more, where gold would spend a considerable amount of time before continuing higher.
A double bottom is two similar lows, confirmed only when the price breaks above the peak between them. On this chart that peak is $4,701.503.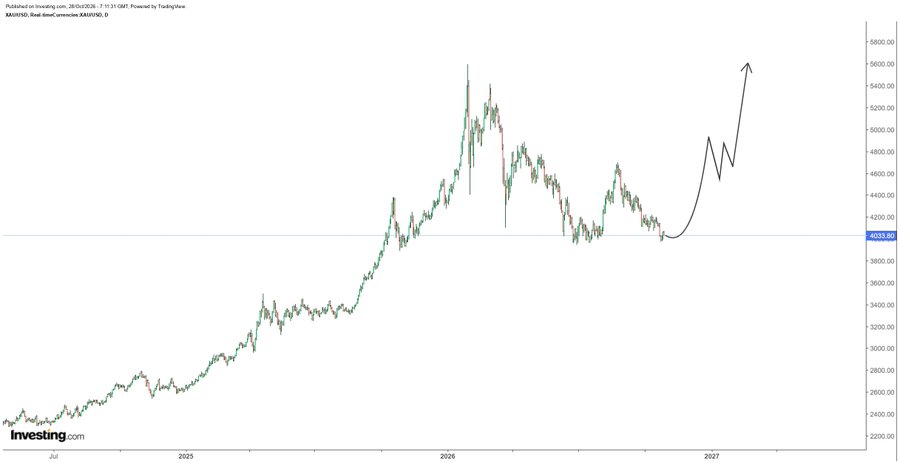
FOMC Update: Fed Holds Rates
The Fed held its rate at 3.75%–4.00% on October 28 in a 10–2 vote, with two officials wanting a quarter-point hike. Higher rates can weigh on gold, which pays no interest. September PCE inflation data is due today at 8:30 am Eastern, about 6 pm IST, per FinanceFeeds.
XAU/USD Prediction: Chart Analysis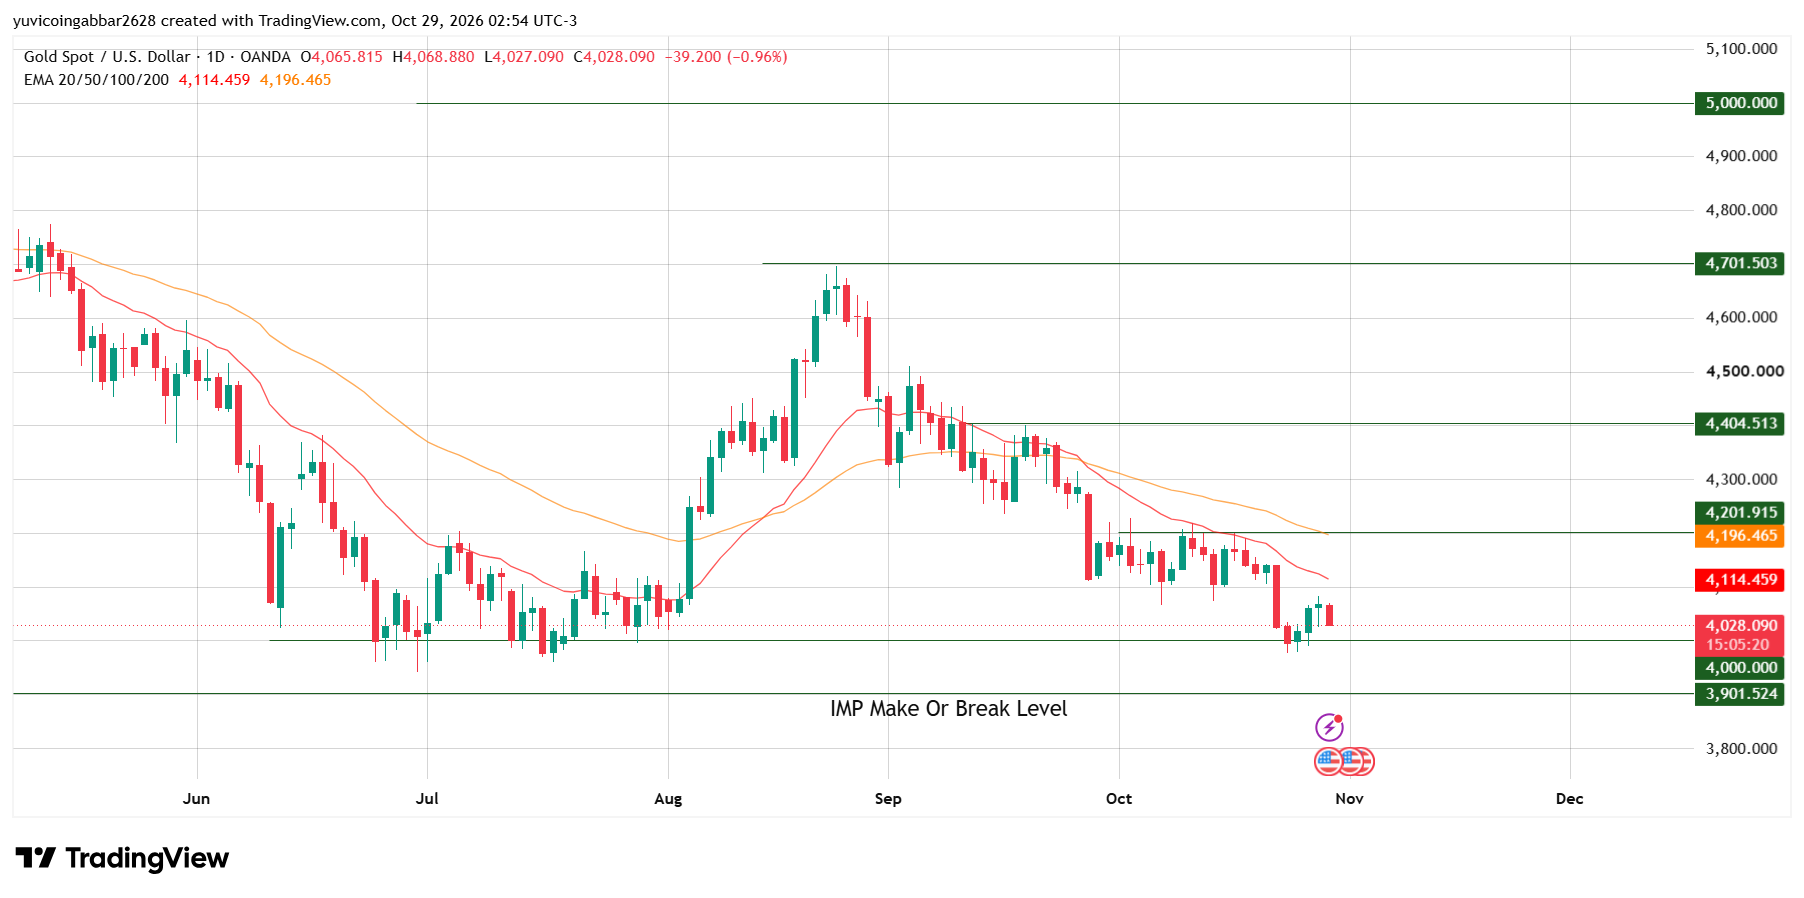
Gold peaked near $4,700 in August, then fell steadily. It dipped under $4,000 in late October and bounced. The chart's earlier low sits in July, also near $4,000, give the double bottom shape.
Today's candle opened at $4,065.815 and printed $4,028.09. An EMA, or exponential moving average, weights recent prices more heavily. The chart shows the 20 and 50 EMAs. Price is about 2.1% under the 20 EMA $4,114.459 and 4.2% under the 50 EMA $4,196.465.
Gold Forecast: Support and Resistance Levels
Type | Level |
Highest marked level | $5,000.000 |
Resistance 4 | $4,701.503 |
Resistance 3 | $4,404.513 |
Resistance 2 | $4,201.915 |
Immediate support | $4,000.000 |
Make-or-break level | $3,901.524 |
Bull case: A daily close above the 20 EMA at $4,114.459 and then $4,201.915 would put $4,404.513 in play.
Bear case: If gold closes below $4,000, the price could slide about 3% toward $3,901.524.
GOLD Price Forecast: Scenarios and Invalidation (October 29, 2026)
Scenario | Trigger | Likely Outcome | Invalidation |
Bull | Close above $4,201.915 | Move toward $4,404.513 | Close below $4,000 |
Base | Range of $4,000 to $4,114.459 | Sideways near $4,000 | Break of either level |
Bear | Close below $4,000 | Slide toward $3,901.524 | Close back above $4,000 |
Gold Price Prediction 2026: Can Gold Reach $5,000?
It would take a gain of about 24% from $4,028.09. Any gold Forecast toward that level needs more than a bottom call.
Gold Price Prediction: Expert View
The three posts agree that $4,000 matters but not on why gold fell or when it turns. For now, the price sits under both EMAs.
The level to watch is $4,000. A daily close below it would open $3,901.524, while a close above $4,201.915 would be the first real sign of strength.
Disclaimer
This article is for informational purposes only and isn't financial advice. Markets are volatile. Always do your own research before making any trading decisions involving gold.



















