Pi Network Price Prediction: Can PI Clear $0.0817 After Four Updates?


The latest Pi Network price prediction is rising after Pi Network announced four updates aimed at developers and outside businesses.
The Pi coin has been flat over the last 24 hours, and traders want to know whether the news can lift the price. PI now trades near $0.07753.
Pi Network started in 2019 as a mobile mining app from Stanford graduates, and it opened to outside connections in February 2025.
According to CoinGecko, Pi Network price today is $0.07753, within a 24-hour range of $0.07598 to $0.07898. PI ranks 78th by market capitalization at about $878.709 million.
Live Pi Network Market Data
Metric | Value |
PI Price | $0.07753 |
24h Change | -0.0% |
24h Range | $0.07598 to $0.07898 |
Market Cap | $878.709M |
PI/BTC | 0.0000009934 BTC (-0.2%) |
Market Rank | #78 |
Source: CoinGecko, as of November 2, 2026.
Pi Network News Today
Pi Network news today centers on four updates. According to BSCN, the Pi Core Team introduced changes aimed at developers and third-party businesses.
The first is an enhanced developer portal that makes it easier to configure apps.
The second adds price information for Launchpad Testnet tokens to the Pi BlockExplorer. 
Source: Data Taken From the @BSCNews X Account, as of November 2, 2026.
The third is SoloHost, which brings AI-powered app packaging to Pi Desktop. The fourth is PiVerify, which provides identity verification services.
The post says the updates aim to lower barriers for developers building in the Pi ecosystem.
KuCoin News reported in June that Pi unveiled SoloHost and PiVerify at Pi2Day 2026, so parts of this news build on earlier products. The post gave no launch dates or usage figures for the new changes.
Pi Network Technical Analysis
This Pi Network price prediction November 2 reads the daily PI/USDT chart on OKX.
Price moves inside a falling wedge that formed after $PI peaked near $0.101 in early September. The current price sits about 23% below that high.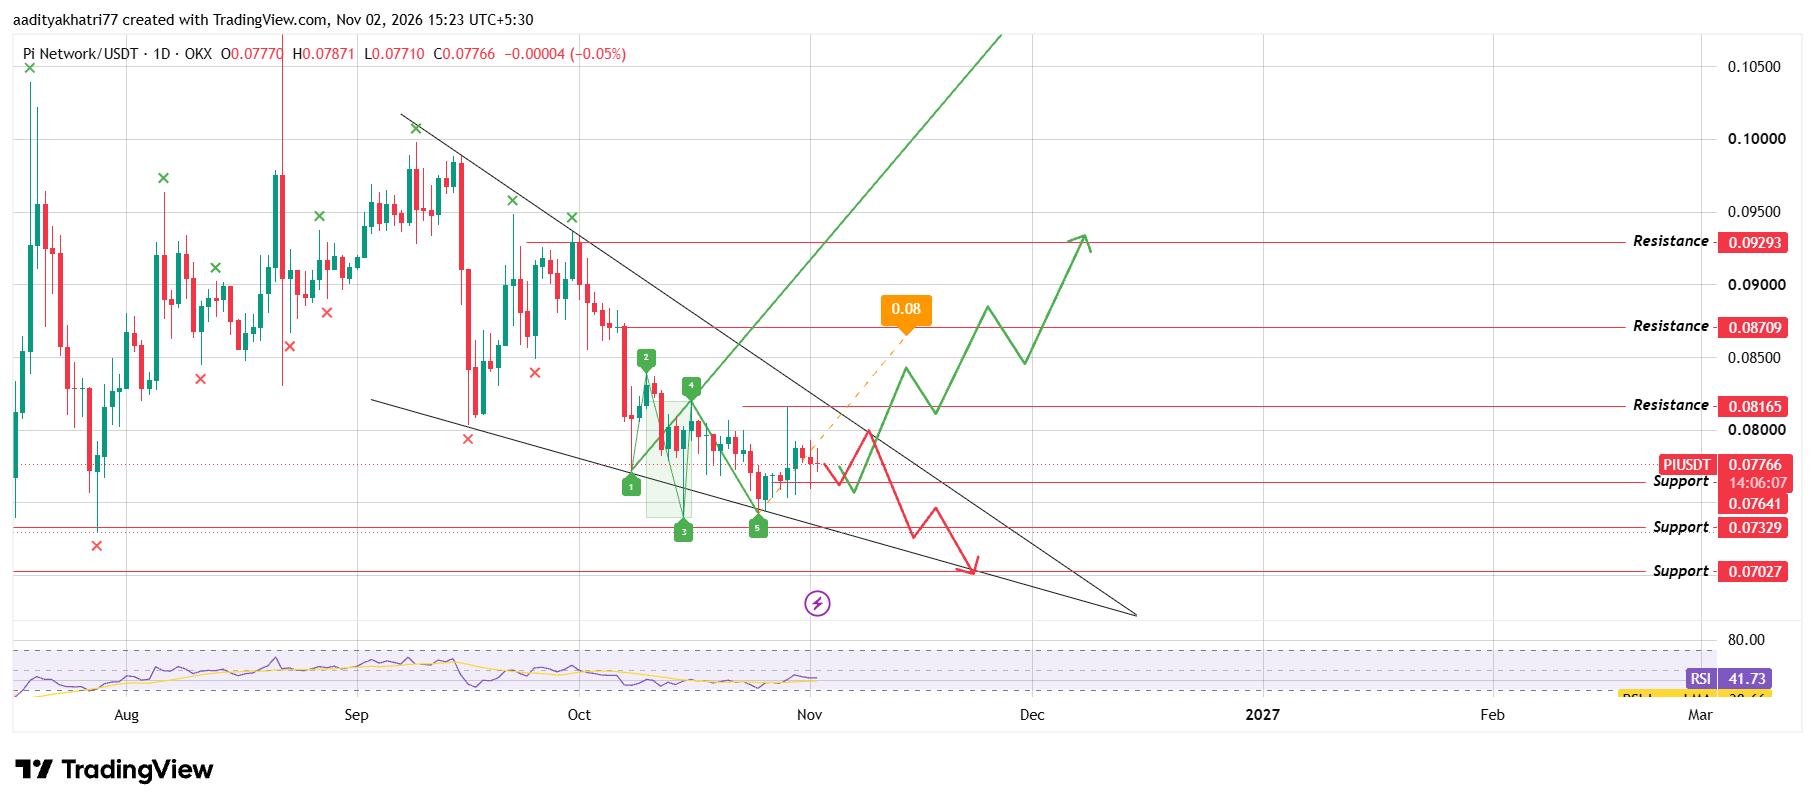
Source: TradingView, PI/USDT 1D, OKX, as of November 2, 2026.
Both trendlines slope down, and they are converging. The upper line now runs near $0.0823 and the lower one near $0.0735, so the range keeps narrowing.
Price fell to a low near $0.0745 in late October. A spike to $0.0816 on October 29 was rejected.
The current candle opened at $0.07770, ranged from $0.07710 to $0.07871, and traded near $0.07766, a decline of 0.05%. The RSI reads 41.73, which shows weak momentum above the 30 oversold line.
Can $PI Bounce and Break the Falling Trendline?
The bullish case starts with a hold. PI needs to keep $0.07641 intact, since price has bounced from that area several times in recent weeks.
The next step is a daily close above $0.08165 and the upper wedge trendline, near $0.0823, with volume over the 20-day average.
The price was rejected at $0.08165 on October 29, so a close on thin volume would carry little weight.
A confirmed break would open $0.08709 first and then $0.09293. A falling wedge often resolves upward, yet it can also fail, so confirmation matters.
What Happens If $PI Loses Support?
The bearish case begins with a rejection below $0.08165 or a slide back toward $0.07641. A daily close under $0.07641 on selling volume above the 20-day average would show that the bounce has failed.
The next support is $0.07329, which sits close to the lower wedge line near $0.0735. A close below both would open $0.07027.
A brief wick under support is not enough. If price closes back above $0.07641 within a day or two, the move may prove a false break.
Price Levels to Watch
Support | Resistance |
$0.07641 | $0.08165 |
$0.07329 | $0.08709 |
$0.07027 | $0.09293 |
Bull, Base, and Bear Scenarios for Pi Network Price Prediction
Scenario | Setup | Level |
Bull | PI holds $0.07641, then a daily candle finishes above $0.08165 and the upper wedge line with volume over the 20-day average. | $0.08709 first, then $0.09293 |
Base | PI keeps squeezing inside the wedge, with no daily close beyond $0.07641 or $0.08165. | Between $0.07641 and $0.08165 |
Bear | Buyers lose $0.07641, and a daily candle settles beneath it and the lower wedge line while volume runs above the 20-day average. | $0.07329 first, then $0.07027 |
Pi Network vs Bitcoin
Any Pi Network price prediction should check how $PI trades against Bitcoin. Over the last 24 hours, PI is flat in dollars and down 0.2% against Bitcoin.
Together, those figures imply that Bitcoin gained about 0.2% in dollar terms. $PI therefore lagged Bitcoin slightly. The gap is small, so the news has not yet changed how PI trades.
Methodology
This Pi Network price prediction 2026 draws on three inputs. Market data comes from CoinGecko and was taken on November 2, 2026.
The chart is a daily PI/USDT view from OKX in TradingView, with timestamps in UTC+5:30. The news item comes from a single BSCN post.
Support and resistance levels were read directly from the chart. The wedge trendlines carry no labels, so the $0.0823 and $0.0735 readings are approximate.
The distance of about 23% from the September high uses a chart reading near $0.101.
CoinGecko combines prices from many exchanges, so its 24-hour range differs slightly from the OKX candle.
The RSI average was not clearly visible on the chart, so only the RSI reading is used.
Trading volume, supply figures and liquidation data were not part of this review, and the scenarios carry no assigned probabilities.
Expert Opinion
The post from BSCN describes tools for developers and businesses. As general market commentary, such updates matter most when they bring real usage, such as apps built or businesses paying for verification.
The post gave no adoption figures, so the effect on demand cannot be judged yet.
In the short term, the $0.07641 level and the volume on any move toward $0.08165 will show whether buyers give the news weight.
Disclaimer: This article is for information only and is not financial advice. PI is volatile, and price can fall below $0.07027 if support fails and broader market conditions weaken. A falling wedge can resolve in either direction. No scenario here carries a stated probability, and a confirmed breakout can still reverse. Readers should do their own research and size any position to a loss they can accept.