Dogecoin Price Prediction: $DOGE Could Flip Bullish With One Breakout


Dogecoin started in 2013 as a joke based on the Shiba Inu meme, and somehow it turned into one of crypto's most recognized names.
Today DOGE trades at $0.06997, well below its all-time high of $0.74, hit back during the 2021 bull run.
This dogecoin price prediction looks at a coin still trading a fraction of that peak, even after over a decade in the market.
With a circulating supply of 155.444B out of 171.156B total, $DOGE remains one of the most liquid meme coins around, and that liquidity keeps it relevant in every market cycle.
$DOGE Live Market Data
$DOGE is currently trading at $0.06997, virtually flat over the past 24 hours. The daily range has moved between $0.06941 and $0.07027. 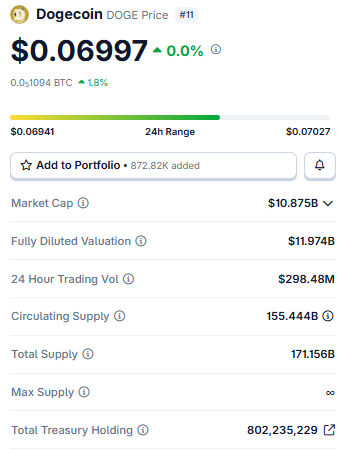
Source: $DOGE market cap data taken from Coingecko, data as of Aug 11, 2026. Figures may vary slightly across other tracking websites.
Market cap stands at $10.875B, with a fully diluted valuation of $11.974B.
Circulating supply sits at 155.444B DOGE against a total supply of 171.156B, and there's no max supply cap; DOGE is inflationary by design.
Trading volume over the last 24 hours came in strong at $298.48M.
Liquidation Data of $DOGE
The past 24 hours saw $570.37K in total $DOGE liquidations, and longs took the brunt of it at $532.25K against just $38.12K in shorts. 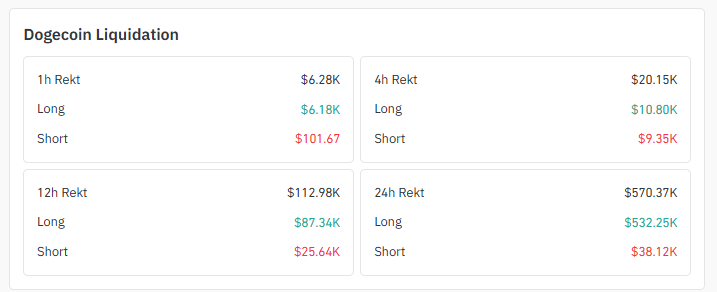
Source: Liquidation Data Taken From Coinglass.
That pattern holds across shorter windows too; the 12-hour figure shows $87.34K in long liquidations versus $25.64K on shorts.
Even the 4-hour window leans long-heavy at $10.80K versus $9.35K. Traders betting on an upside move have been getting caught out more often than those shorting the dip.
Exchange Volume
Binance leads DOGE trading by a wide margin, handling $181.34M in daily volume. 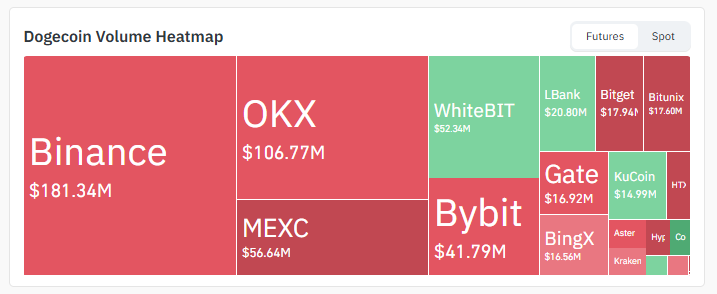
Source: Volume Heatmap Data Taken From Coinglass.
OKX follows at $106.77M, with MEXC and Bybit contributing $56.64M and $41.79M, respectively.
WhiteBIT, Gate, KuCoin, Bitget, Bitunix, and LBank round out the rest with smaller but consistent volume.
This kind of spread across major exchanges keeps DOGE's liquidity deep, regardless of which direction the breakout goes.
Key Takeaways
-
DOGE trades near $0.06997, flat on the day after a 0.66% daily gain.
-
On the 1H chart, price is testing the upper boundary of an ascending triangle at $0.07096.
-
The daily chart shows $DOGE consolidating inside a tight red box; a breakout on either side could set the next trend.
-
Long positions took the bigger liquidation hit, over $532K wiped out in the past 24 hours.
-
Binance dominates $DOGE trading volume, handling $181.34M of daily activity.
Technical Analysis for $DOGE
Hourly Chart Analysis for Dogecoin Price Prediction
On the 1H chart, $DOGE sits inside an ascending triangle and is currently testing the upper resistance boundary of the triangle. 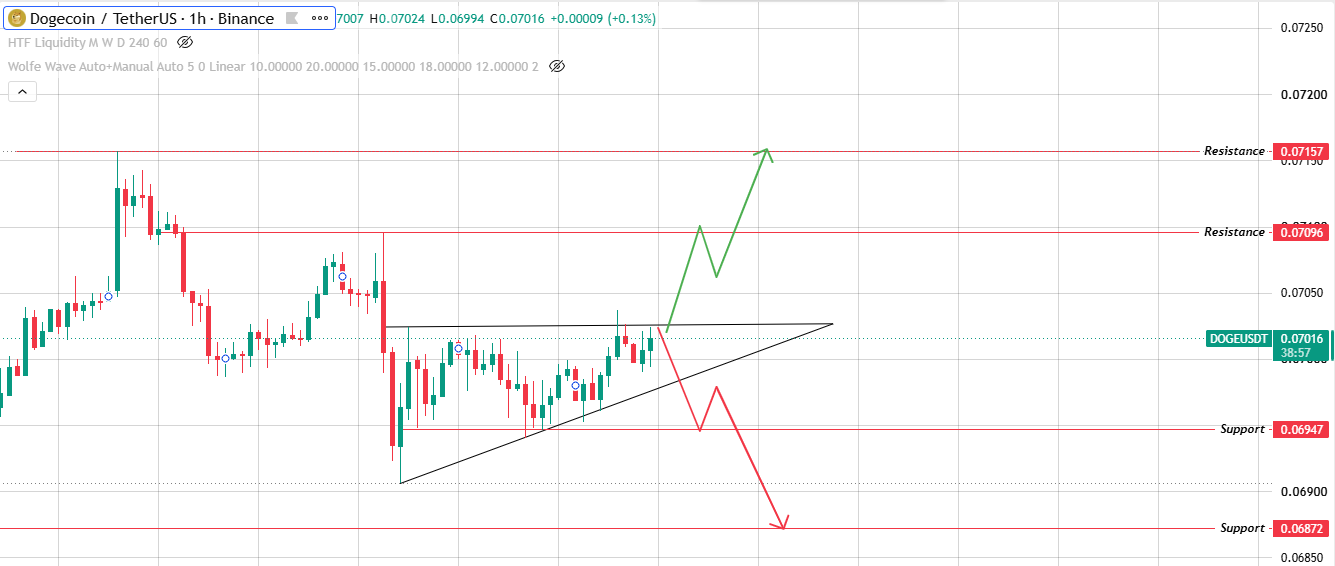
Source: Chart Taken From TradingView.
A volume-backed breakout here could push the price toward $0.07096 and then $0.07157 next.
If buyers get rejected at this level instead, price likely drifts back to test the triangle's rising trendline, and a break below that opens a path toward $0.06947 and then $0.06872.
Daily Chart Analysis for Dogecoin Price Prediction
The daily chart shows a different picture; $DOGE has been consolidating inside a tight red box for a while now. If volume picks up on either side, it decides the next move. 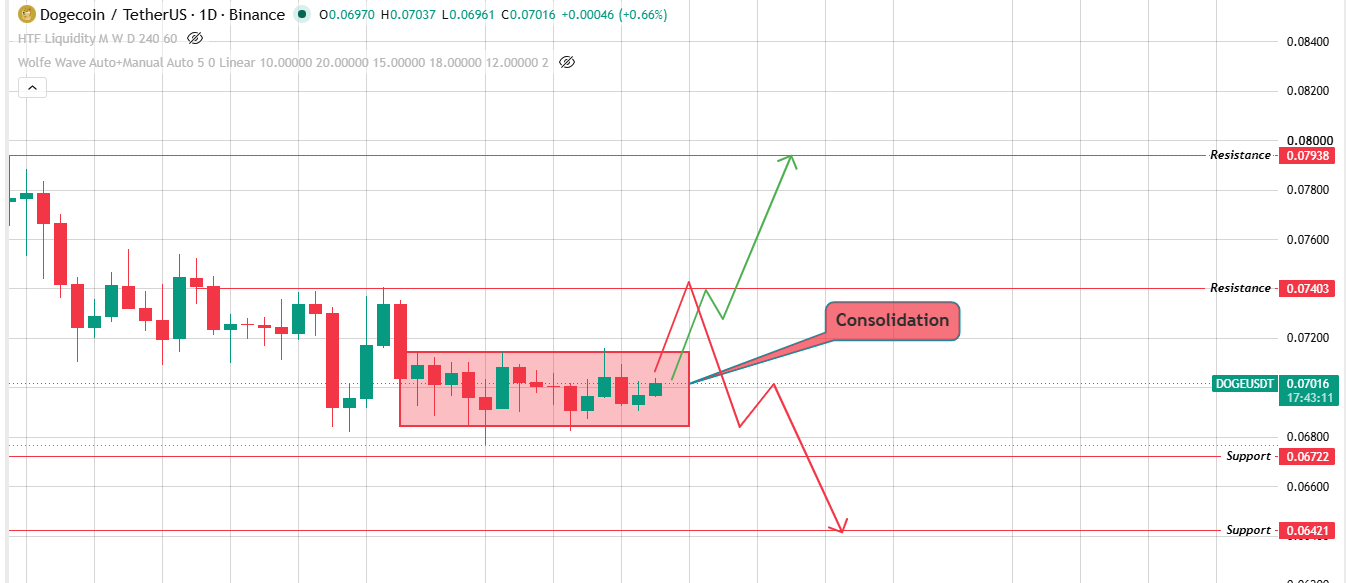
Source: Chart Taken From TradingView.
A breakout above the box level is $0.07403 first, then $0.07938.
A breakdown below the lower boundary sends the price toward $0.06722 and possibly $0.06421.
Both charts point to the same idea: DOGE is coiled and waiting on a volume trigger.
Bull / Base / Bear Case
Glossary
Ascending Triangle: A pattern with a flat resistance line on top and a rising support line below, often resolving upward.
Consolidation: A period where price trades sideways in a tight range before choosing its next direction.
Liquidation: This happens when an exchange force-closes a leveraged position after a trader's margin runs out.
Support Zone: A price area where buying pressure has historically stepped in to halt declines.
Resistance Level: A price ceiling where selling pressure tends to cap further upside.
Methodology
Levels used in this dogecoin price prediction come directly from TradingView chart data on the 1H and 1D timeframes.
Liquidation and volume figures are sourced from Coinglass. No price levels are extrapolated beyond what appears on the charts.
Disclaimer: This article is for informational purposes only and should not be treated as financial advice. Cryptocurrency markets are highly volatile, and prices can change quickly. Always do your own research and consult a financial advisor before making investment decisions.

















