Ondo Price Prediction September 2026: RWA News Fuels ONDO


This Ondo price prediction September 2026 arrives at a moment when a trendline that has defined an entire year and a half of price action has finally given way.
A downtrend that started back in December 2024 pinned this chart lower through wave after wave of selling, and now, for the first time in a long while, price is holding above it instead of getting pulled back under.
Whether that holds up or turns into another false dawn is exactly what this update digs into. Here's the full picture.
ONDO Price Today: Live Data and 24-Hour Change
ONDO is trading near $0.3674 on the weekly chart. Separate live data from CoinGlass puts the coin around $0.3677, down close to 5.74% over the past 24 hours, with futures volume of $249.63 million against spot volume of $68.21 million and open interest at $243.29 million.
Market cap stands at $1.79 billion on a circulating supply of 4.86 billion Ondo out of a total and max supply of 10 billion tokens, meaning just under half of Ondo's eventual token supply is currently in circulation.
Source: TradingView (ONDO/USDT perpetual, Binance, weekly chart) and CoinGlass, both accessed August 25, 2026, IST.
ONDO News: Coinbase Enters the Tokenized Stocks Race
An X post from commentary account ALLINCRYPTO, published roughly 20 hours before this piece, flagged a significant move from Coinbase into tokenized real-world assets.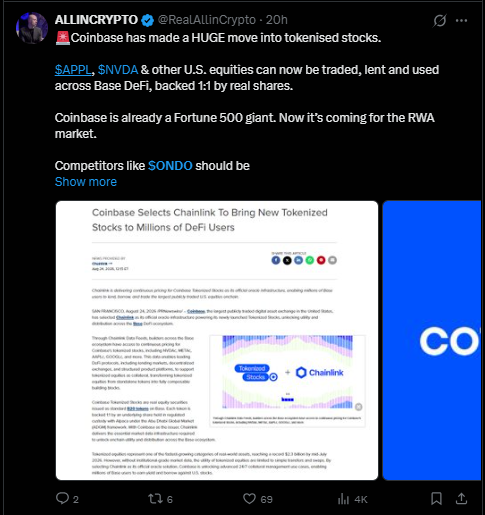
According to the post, Coinbase now allows equities like Apple and Nvidia shares to be traded, lent, and used across its Base DeFi ecosystem, with each token backed one to one by real underlying shares, and the post directly named ONDO as a competitor now facing pressure from a Fortune 500 giant entering the RWA tokenization space.
An accompanying PR Newswire article embedded in the thread detailed how Coinbase selected Chainlink to power pricing infrastructure for these tokenized stocks, enabling DeFi protocols to use tokenized equities as collateral across lending markets and decentralized exchanges.
The article noted that tokenized equities have become one of the fastest-growing real-world asset categories, with the segment reaching a market cap record above $2 billion this past July alone.
For an RWA-focused token prediction like ONDO, that combination of validation for the broader tokenized asset category and fresh competition from a major exchange cuts both ways.
Source: X post by @RealAllInCrypto, referencing a Coinbase PR Newswire release, posted roughly 20 hours before this piece, August 24-25, 2026.
Quick Take
CMP: $0.3674
Weekly trigger: close above $0.4855, opens $0.6228, then $1.1693
Weekly failure: close below $0.2404 invalidates the bullish structure
Data as of August 25, 2026, IST
Short risk note: these levels come from the weekly chart and depend on confirmed weekly closes, not intraday wicks.
Leveraged positions around these zones carry liquidation risk if price whipsaws before a level is confirmed.
Ondo Technical Forecast September 2026
The dominant feature on this $ONDO chart is a descending trendline that has been in place since December 2024, guiding the price steadily lower through more than a year of selling pressure.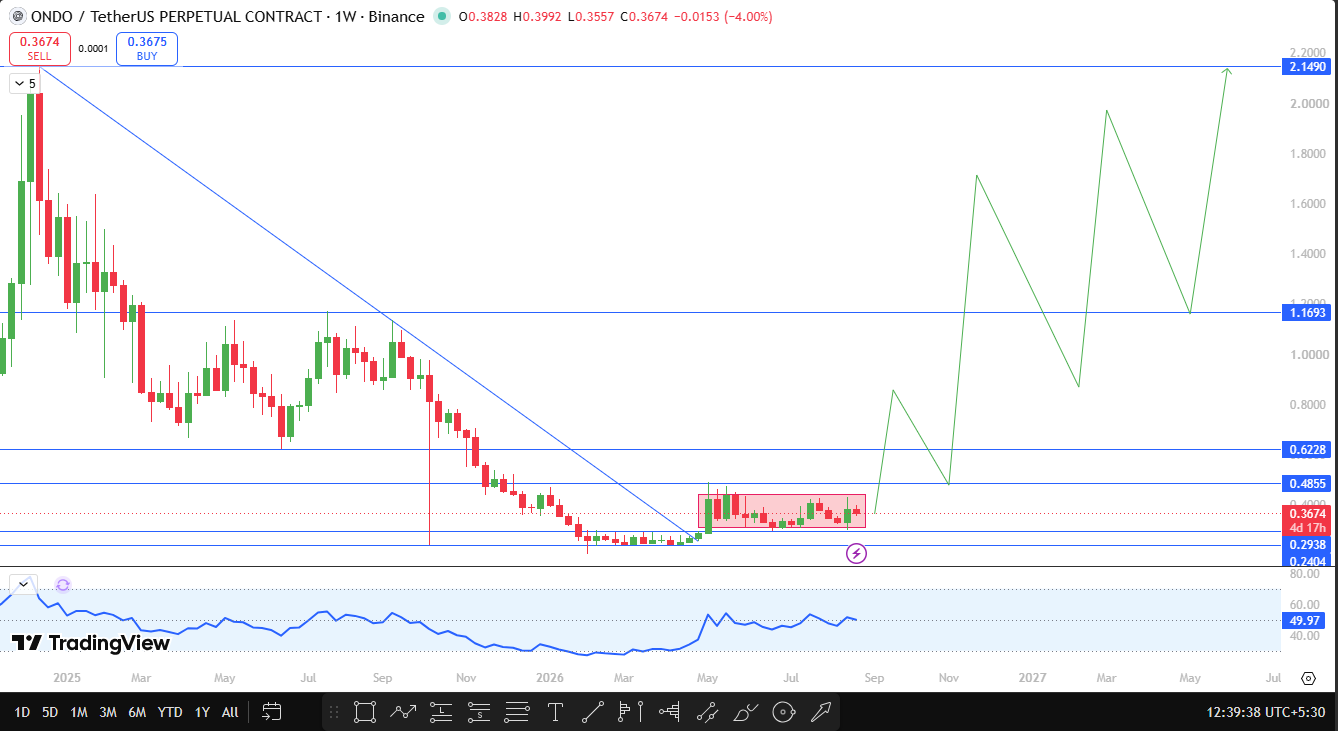
That kind of long-running structure tends to carry weight, and breaking it cleanly is usually a meaningful technical event rather than a minor blip.
That is exactly what has happened here.
price recently broke out of that trendline, and rather than immediately rolling back over the way so many prior bounces did, price has been sustaining above the breakout zone.
The chart's momentum indicator is currently reading near 49.97, sitting almost exactly at the midpoint, consistent with a market that has stabilized without yet confirming a decisive trend shift in either direction.
If price breaks and closes a weekly candle above $0.4855, roughly 32.14% above current price, it opens the door to $0.6228 as the next resistance, a level around 69.52% higher.
Beyond that, $1.1693 stands out as a major swing high on the chart, sitting close to 218.26% above current price, with $2.1490 marked as the extended target near 484.89% higher if this ONDO price forecast September 2026 plays out toward its full potential.
On the downside, a weekly close below $0.2404, about 34.57% under current price, would invalidate this bullish structure entirely, suggesting the year-and-a-half-long downtrend has reasserted itself despite the recent breakout.
Source: TradingView, ONDO/USDT perpetual chart, 1-week timeframe, Binance, captured August 25, 2026, IST.
ONDO Support and Resistance Levels to Watch
Level Type | Price | Change from CMP | Note |
Support | $0.2404 | -34.57% | Weekly close below this invalidates the bullish setup. |
Support | $0.2938 | -20.03% | Recent swing low, near-term support |
Resistance | $0.4855 | +32.14% | The weekly close above this confirms continuation. |
Resistance | $0.6228 | +69.52% | First target after breakout confirmation |
Resistance | $1.1693 | +218.26% | Major swing high, second target |
Resistance | $2.1490 | +484.89% | Extended target if momentum holds |
ONDO Price Prediction: Bull, Base, and Bear Cases
The base case has price continuing to consolidate just above the breakout zone through most of September, without a confirmed weekly close above $0.4855 or below $0.2404, digesting the trendline break before committing to a bigger move.
The bull case activates on a weekly close above $0.4855, which opens a path toward $0.6228 and eventually the $1.1693 and $2.1490 levels further out.
This ONDO technical analysis September 2026 case gets support from the broader tokenized real-world asset narrative gaining traction, even with Coinbase now stepping directly into that category as a competitor.
The bear case needs a weekly close below $0.2404, which would suggest the December 2024 downtrend has reasserted control and put a deeper pullback back in focus.
Every one of these ONDO breakout prediction September 2026 scenarios depends on a confirmed weekly close, not a temporary wick through any level.
On-Chain and Fundamental Drivers
Ondo Finance built its reputation around bringing tokenized US Treasuries and other real-world assets on-chain, a niche that has grown substantially as institutional interest in RWA tokenization has accelerated through 2026.
That positioning gives ONDO a fundamental story tied directly to real economic activity rather than pure speculation, and it is part of why the broader tokenized asset category has continued expanding even through periods of crypto market weakness.
Coinbase's entry into tokenized equities changes the competitive backdrop somewhat, since a major exchange with existing distribution can move quickly once it commits resources to a category.
Whether that pressures Ondo's market share or simply expands the overall tokenized RWA pie for every participant, including ONDO, remains an open question heading into September.
September 2026 Catalysts
How Coinbase's tokenized stocks rollout on Base DeFi develops over the coming weeks is likely to be the most closely watched storyline for ONDO holders, given the direct competitive framing already circulating on social media.
Beyond that, traders will be watching whether ONDO can build enough momentum to test $0.4855, along with broader shifts in Bitcoin dominance and overall crypto market liquidity through the month.
Risks That Could Invalidate This Forecast
This bullish setup fails if ONDO cannot close a weekly candle above $0.4855 and fails more seriously if the price closes below $0.2404, which would suggest the trendline breakout was temporary rather than a genuine structural shift.
Broader risks include intensifying competition in tokenized real-world assets from larger players like Coinbase, shifts in Bitcoin dominance, macro liquidity conditions, and general crypto market volatility, any of which could override ONDO's own chart structure regardless of where its levels sit.
Glossary
Descending trendline: a downward-sloping line connecting a series of lower highs, used to track a prevailing downtrend
Trendline breakout: a move where price closes beyond a trendline that had previously acted as resistance or support
Weekly close: the final traded price when a weekly candle finishes, used to confirm whether a breakout or breakdown is genuine
Open interest: the total number of outstanding futures or options contracts that have not yet been settled
Support: a price zone where buying pressure has previously stepped in
Resistance: a price zone where selling pressure has previously capped upside
Invalidation level: the price point at which a forecast scenario is considered incorrect
Real-world asset Tokenization: the process of representing traditional financial instruments, such as government bonds or equities, as blockchain-based tokens
Disclaimer
This article is for informational purposes only and does not constitute financial advice. Cryptocurrency markets are highly volatile, and all price levels discussed are based on technical chart analysis, not a guarantee of future performance. Readers should conduct their own research before making any investment decisions.

















