Chainlink Price Prediction: Will LINK Break $12.65 After Schwab?


Did LINK just shake off the CPI hangover, or is Schwab talk doing the heavy lifting?
LINK price today is $12.55, up 4.37% in 24 hours, and this Chainlink price prediction continues from yesterday's Chainlink forecast, where $12.522 was the level bulls had to reclaim. They reclaimed it. Next up: $12.646.
Why Is LINK Up Today?
LINK is bouncing. The price jumped from a $11.86 low to $12.58 inside 24 hours, per CoinMarketCap live data. Data time: Oct 16, 2026, 06:45 UTC.
A market summary put $LINK up 3.85% at $12.45, ahead of the broader market's 2.42% and Bitcoin's 1.9%. Relative strength. Three things lined up. A bounce off support. Shorts getting flushed. And institutional headlines. A trend change still needs proof. Volume would help.
LINK Price Today: Market Snapshot
Price and Range
$LINK trades at $12.55 with a 24-hour range of $11.86 to $12.58. But the 7-day move still reads down 1.08%.
Volume and Supply
Volume fell 13.04% to $334.34M while price rose. A rebound on thinner volume deserves caution.
Market cap rose 4.38% to $9.39B, with 748.09M of 1B LINK circulating. The LINK staking update adds context on locked supply.
Yesterday's Prediction: Target vs. Actual Result
Timeframe: Oct 15, 2026, 03:30 UTC to Oct 16, 2026, 08:30 UTC.
Bull target $13.056 needed reclaims of $12.522 and $12.853. LINK reclaimed only $12.522, then topped at $12.58. Status: Not Hit. The base range of $11.95 to $12.522 broke on both sides. Status: Not Hit. Bear target $11.463 needed to trade under $11.95. LINK dipped to $11.82 on Binance, then reversed. Status: Partially Hit.
Chainlink Technical Analysis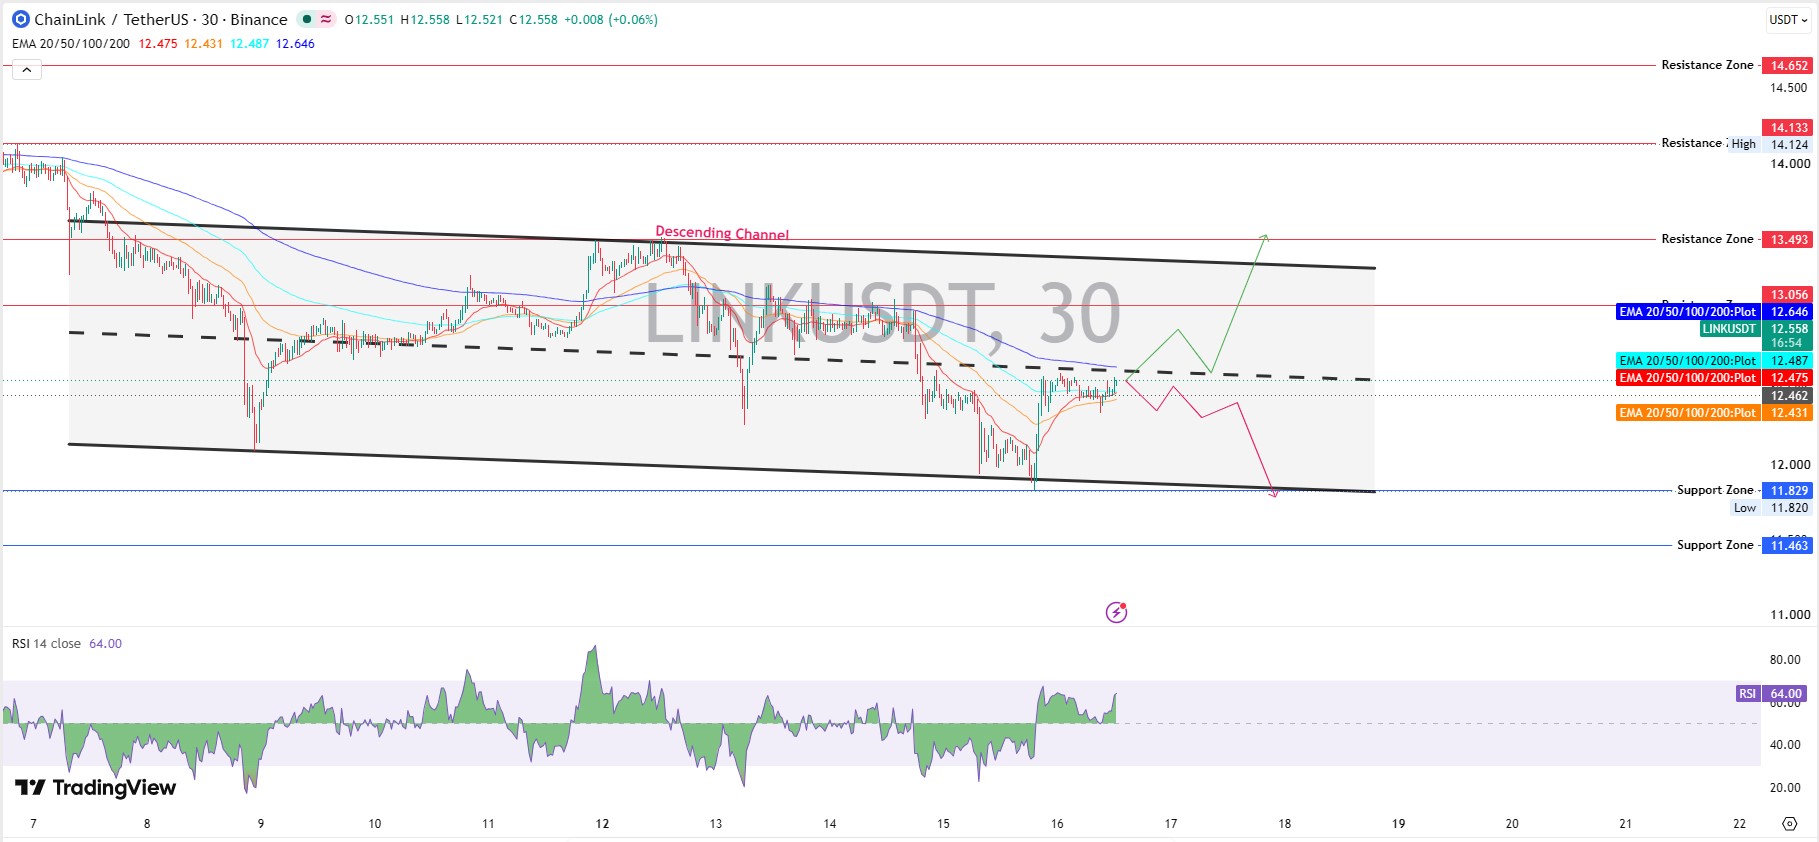
Chainlink technical analysis on the 30-minute Binance chart still shows a descending channel, a lane of lower highs and lower lows, per TradingView chart data.
Price trades above three of the four EMAs. EMA means exponential moving average, a trend line that weights recent trades more heavily.
The 20 EMA is $12.475, the 50 EMA $12.431, the 100 EMA $12.487, and the 200 EMA $12.646.
RSI reads 64.00. That reads like a trend reversal. Or maybe just a relief bounce, since the 200 EMA still sits overhead.
Key Support Levels
$LINK support and resistance levels are packed tightly here. First support is the EMA cluster from $12.431 to $12.487.
Next come $11.829, about 5.7% lower, and $11.463, about 8.7% lower. That last zone echoes the earlier channel test.
Key Resistance Levels
The first hurdle is $12.646, the 200 EMA, about 0.8% higher. Then $13.056, about 4.0% higher, and $13.493, about 7.5% higher.
Chainlink ETF Inflows
Daily Flow Numbers
Chainlink ETF inflows ticked up to $12.16K on Oct 15, 2026, per SoSoValue ETF data, after $0 on Oct 13 and Oct 14. Data covers the US session ending 20:00 UTC.
Net assets rose to $222.78M, or 2.38% of $LINK market cap. Tiny. But positive.
Grayscale and Bitwise Funds
Bitwise's CLNK took in $456.40K, while Grayscale's GLNK lost $444.24K. That nets out to $12.16K. A long way from the record ETF inflow days.
LINK Derivatives Data
Futures and Open Interest
Futures volume reached $422.52M against $74.87M in spot, per CoinGlass derivatives data.
Open interest, the total value of open futures contracts, rose to $595.44M from $557.87M yesterday. Traders are adding exposure. And that cuts both ways.
Liquidations and Long/Short Ratios
Liquidations, meaning forced exits, fell to $496.19K from $2.09M yesterday. Longs took $315.95K of it. Long/short ratios still lean long, at 1.5773 on Binance and 2.71 on OKX. Who gets squeezed next?
Holder Data Snapshot
Holder Count
Holders total 915,878 per Etherscan holder data, up from 915,688 yesterday.
Whale Concentration
Whales, meaning very large wallets, number 4,196, which is four fewer than yesterday. They're 0.46% of holders yet control 90.73% of market cap. The top 100 wallets hold 61.44%, and the LINK wallet count trend tracks the holder climb.
Chainlink News Today
Schwab Year-End Target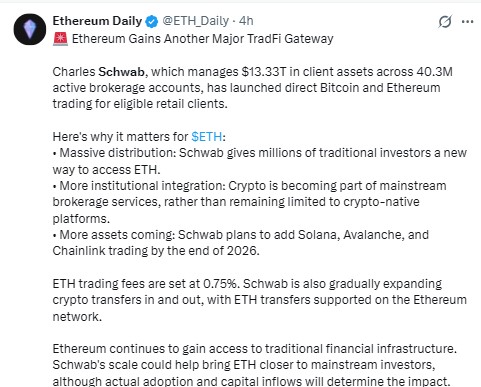
Schwab manages $13.33 trillion across 40.3M active accounts and targets Solana, Avalanche, and Chainlink trading by the end of 2026, per Ethereum Daily's X post from Oct 16, 2026, 04:00 UTC.
Still no live date. Just a target.
Citi Idle Collateral and Fulrum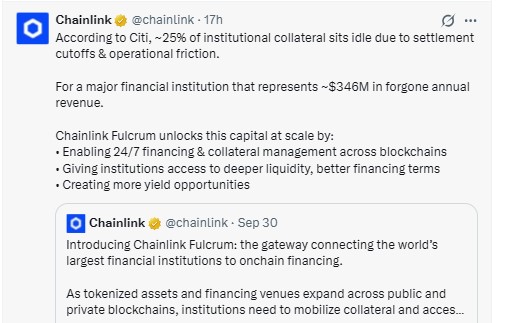
Citi data adds another angle. Per Chainlink's Fulrum post from Oct 15, 2026, 13:55 UTC, about 25% of institutional collateral sits idle.
For a major bank, that's about $346M in forgone annual revenue.
DTCC Collateral Appchain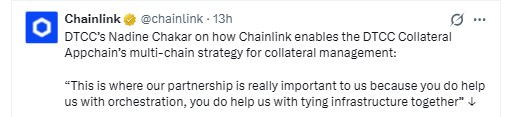
DTCC's Nadine Chakar said the Chainlink partnership helps orchestrate the DTCC Collateral Appchain's multi-chain strategy, per Chainlink's DTCC post on Oct 15, 2026, 17:07 UTC.
Whale Transactions Surge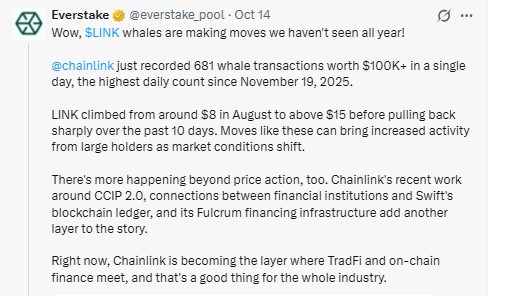
Everstake flagged 681 whale transactions above $100K in a single day, the highest daily count since Nov 19, 2025, per Everstake's X post from Oct 14, 2026, 18:17 UTC.
Where Can LINK Go Next?
Bullish Scenario
Trading above $12.646 on rising volume could open $13.056, about 4.0% higher, within five days. That's the next LINK price target. Fresh ETF demand, like the ETF inflows breakout, would help. Trading under $12.431 cancels it.
Base Scenario
This $LINK price forecast treats $12.431 to $12.646 as the chop zone, which may hold for two to three days.
Bearish Scenario
Trading under $12.431 could pull $LINK toward $11.829 within a week, about 5.7% lower. And a break there would put $11.463 in play.
Chainlink Price Prediction for October 2026
Bull Case
Reaching $14.133 by Oct 31, about 12.6% higher, would need $13.493 to break first.
Base Case
A range of $11.829 to $13.493 could hold most of the month, and the October 2026 price prediction adds the wider view.
Bear Case
Trading under $11.463 could open deeper downside and flip the monthly bias.
Risks That Could Change the Chainlink Price Prediction
Fading volume is one risk. Crowded longs are another. And the Fed meets on Oct 27 to 28. Adoption news, like CCIP vault adapters, can lift sentiment. But macro usually wins short-term.
Final Takeaway
This Chainlink price prediction leans bullish while $LINK trades above $12.431. And $12.646 decides whether the rebound has legs. A bounce on fading volume needs proof. Timing matters.
Disclaimer: This article is for educational market analysis only and isn't financial advice. Crypto assets are highly volatile, and readers should research independently before trading.
















