Crude Oil Price Prediction: Can WTI Reach $108 After Argentina News?


Interest in the latest crude oil price prediction is rising as WTI trades above $100 a barrel and fresh supply news from Argentina draws attention.
Oil is down 0.29% today, which leaves traders asking whether the recent strength can continue.
WTI now trades near $101.65, and the next few sessions may show how much weight the market gives the news.
WTI, short for West Texas Intermediate, is a light US crude grade that serves as a global oil price benchmark. Its futures are delivered at Cushing, Oklahoma.
According to TradingView, WTI crude oil price today is $101.65 per barrel, down $0.30 as of 15:20 on October 29, 2026 (UTC+5:30).
Live WTI Crude Oil Data
Metric | Value |
Instrument | CFD on WTI Crude Oil (USOIL) |
Price | $101.65 per barrel |
Change | -$0.30 (-0.29%) |
Quote Time | 15:20, October 29, 2026 (UTC+5:30) |
Source: TradingView, TVC feed, as of October 29, 2026.
Crude Oil News Today
Crude oil news today comes from Argentina. According to a social media post citing Reuters, the state oil company YPF locked in a profit of about $1.2 billion. Revenue rose roughly 41% to about $6.6 billion.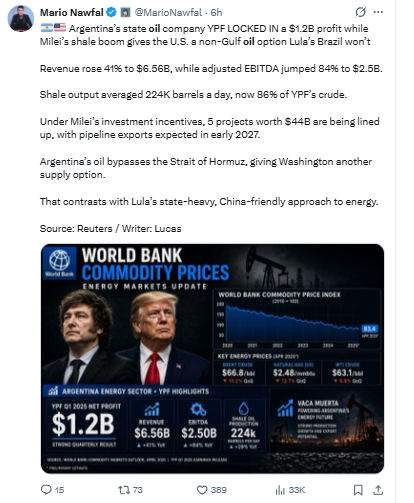
Source: Data Taken From @MarioNawfal X Account, as of October 29, 2026.
The post links the result to growing shale output. It says five projects worth $44 billion are being lined up, with pipeline exports expected in early 2027.
It adds that Argentine crude does not pass through the Strait of Hormuz, which gives buyers another supply route.
These figures are as reported in the post, and readers should confirm exact numbers in company filings.
Crude Oil Technical Analysis
This crude oil price prediction October 2026 reads the 4-hour WTI chart from TradingView. Price moves inside an ascending channel that began with a low near $95.29 around October 20.
The chart also marks a five-point Wolfe wave. Point 4 formed near $104 on October 23. 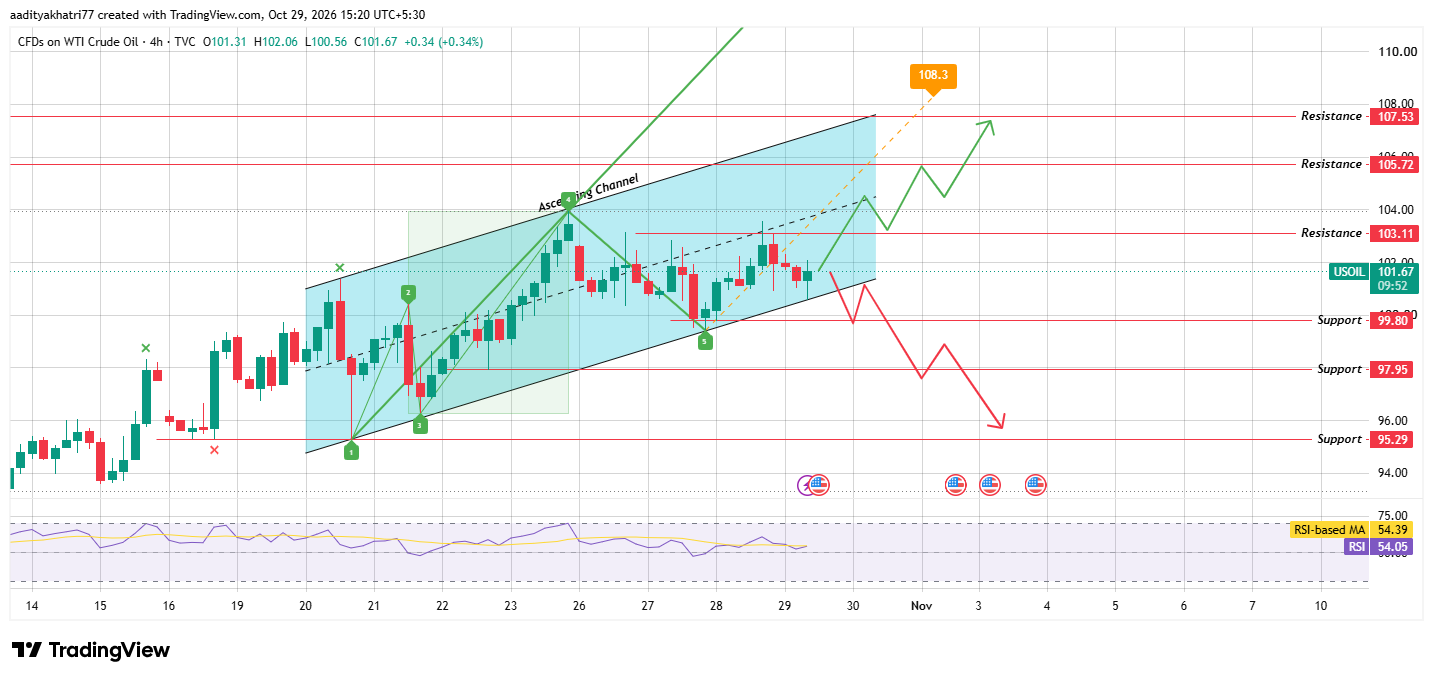
Source: Chart Taken From TradingView, USOIL 4H, TVC, as of October 29, 2026.
Point 5 formed near $99.80 on October 28, where price touched the lower boundary of the channel. A line drawn from point 1 through point 4 projects toward $108.3 in early November.
The current 4-hour candle opened at $101.31, ranged from $100.56 to $102.06 and trades near $101.67, a gain of 0.34%.
The RSI reads 54.05, almost level with its average of 54.39, which shows balanced momentum.
Can Crude Oil Bounce From the Channel and Break $103.11?
The bullish case starts with a hold. WTI needs to defend the lower boundary of the channel, which sits near $100.6, and the $99.80 level just beneath it.
The next step is a 4-hour candle close above $103.11 with WTI futures volume above its 20-period average. That level capped price on October 28, so a close on thin volume would carry little weight.
After a confirmed break, $105.72 is the first resistance, followed by $107.53, which sits close to the upper boundary of the channel.
The Wolfe wave projection near $108.3 lies just above that boundary, so reaching it would also mean a breakout from the channel.
What Happens If Crude Oil Breaks the Channel and $99.80?
The bearish case begins when the bounce fails. If a 4-hour candle closes below both the lower channel boundary and $99.80 with above-average futures volume, the rising structure would break.
In that case, $97.95 is the first support, followed by $95.29. The second level matches the October low where the Wolfe wave began.
A brief move under the channel is not enough. If price closes back inside within a few candles, the move may prove a false break, and the channel would stay intact.
Price Levels to Watch
Support | Resistance |
$99.80 | $103.11 |
$97.95 | $105.72 |
$95.29 | $107.53 |
Bull, Base, and Bear Scenarios for Crude Oil Price Prediction
Scenario | Setup | Level |
Bull | WTI bounces off the lower channel boundary, then a 4-hour candle closes above $103.11 with futures volume over the 20-period average | $105.72 and $107.53, with the Wolfe projection near $108.3 |
Base | WTI keeps moving inside the channel with no 4-hour close beyond $99.80 or $103.11 | Between $99.80 and $103.11 |
Bear | A 4-hour candle closes under the channel and $99.80 while selling volume runs above the 20-period average | $97.95 first, then $95.29 |
Methodology
This crude oil price prediction 2026 draws on three inputs. The price quote comes from the TVC feed on TradingView for the WTI CFD and was taken at 15:20 on October 29, 2026.
The chart is a 4-hour USOIL view from the same feed. The news item comes from one social media post that cites Reuters.
Support, resistance and Wolfe wave levels were read directly from the chart. The channel boundaries carry no labels, so the $100.6 and $107.5 readings are approximate.
The quote and the chart were captured minutes apart, which explains the $0.02 gap between them.
Futures volume, inventory data and Brent prices were not part of this review. The news figures were not checked against company filings, and the scenarios carry no assigned probabilities.
Expert Opinion
The report on YPF points to rising shale output in Argentina. As general market commentary, a new supply route can matter over time, yet the output of one company is small against global demand.
Near-term price direction therefore depends more on the chart than on this news. The $99.80 level will show whether buyers defend the channel, and a close above $103.11 would show that momentum is building.
Disclaimer: This article is for information only and is not financial advice. Oil is volatile, and price can fall below $95.29 if the channel fails and broader market conditions weaken. Leveraged products such as CFDs can magnify losses. No scenario here carries a stated probability, and a confirmed breakout can still reverse. Readers should do their own research and size any position to a loss they can accept.