Crude Oil Price Prediction: Can Russia Refinery Fire Lift WTI to $107?


The latest crude oil price prediction is rising after a social media post reported a new Ukrainian strike on a Russian oil refinery.
Oil is up 1.16% today, and traders want to know whether supply worries can carry the price higher. WTI now trades near $104.04 per barrel.
West Texas Intermediate, or WTI, is a high-quality US crude blend that serves as a global price benchmark, with delivery at Cushing, Oklahoma.
According to TradingView, WTI crude oil price today is $104.04 per barrel, up $1.19 as of 15:36 on October 30, 2026 (UTC+5:30).
Live Crude Oil Data
Metric | Value |
Instrument | CFD on WTI Crude Oil (USOIL) |
Price | $104.04 per barrel |
Change | +$1.19 (+1.16%) |
Quote Time | 15:36, October 30, 2026 (UTC+5:30) |
Source: TradingView, TVC feed, as of October 30, 2026.
Crude Oil News Today
Crude oil news today centers on Russia. According to the Hormuz Letter, Ukraine struck the Novokuibyshevsk oil refinery this morning and set it ablaze. The post says black smoke rose several kilometers.
It calls this the first Ukrainian strike on Russian oil infrastructure in nearly two weeks, after the St. Petersburg oil port on October 18. 
Source: Data Taken From @HormuzLetter X Account, as of October 30, 2026.
It also says Rosneft has stopped repairing most of its refineries because the damage cycle has become too expensive.
A search found no separate confirmation of today's strike or the Rosneft statement.
Earlier reports show the same refinery has been hit before, so readers should treat both claims as unverified for now.
Crude Oil Technical Analysis
This crude oil price prediction October 2026 reads the 4-hour WTI chart from TradingView.
Price trades above a rising trendline that began with a low near $93.5 around October 14. Since then WTI has made higher highs and higher lows.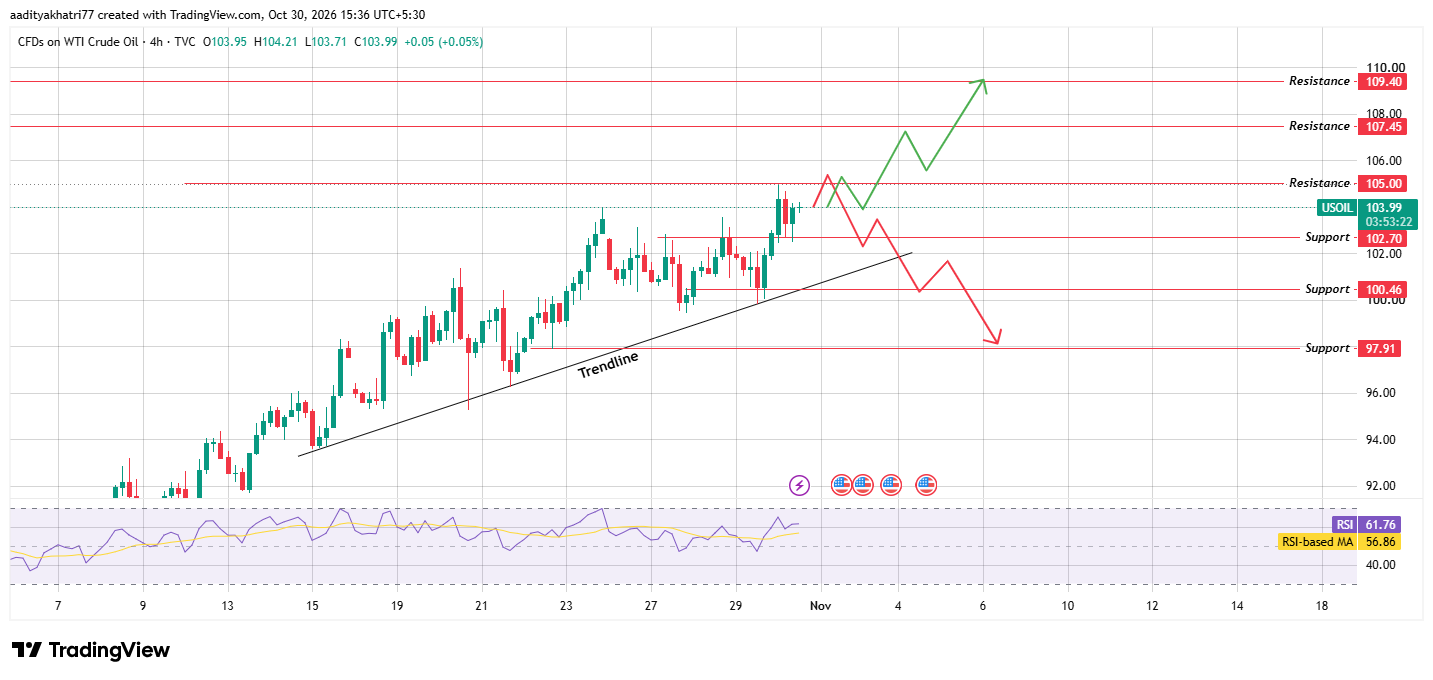
Source: TradingView, USOIL 4H, TVC, as of October 30, 2026.
The price tested $105 overnight and pulled back below it. The candle high near $105.2 failed to hold, so $105.00 now acts as the first resistance.
The current candle opened at $103.95, ranged from $103.71 to $104.21, and traded near $103.99.
The RSI reads 61.76 against its average of 56.86, which shows firm momentum below the 70 overbought line.
Can Crude Oil Bounce and Break $105.00?
The bullish case starts with a hold. WTI needs to keep the rising trendline and the $102.70 level intact, since both have guided the climb.
The next step is a 4-hour close above $105.00 with WTI futures volume over the 20-period average. Price already failed once at that level, so a close on thin volume would carry little weight.
After a confirmed break, $107.45 is the first resistance and $109.40 the next.
Both levels sit in a zone where price has not traded during this advance, so reactions there are harder to predict.
What Happens If Crude Oil Loses the Trendline?
The bearish case begins with a rejection at $105.00. In that case, the price would likely return toward $102.70, the first support.
A 4-hour close below $102.70 would put the trendline and $100.46 in play. The trendline runs near $100.4, so both sit close together.
A close below both, with selling volume above the 20-period average, would open $97.91.
A brief wick under the trendline is not enough. If the price closes back above it within a few candles, the move may prove a false break.
Price Levels to Watch
Support | Resistance |
$102.70 | $105.00 |
$100.46 | $107.45 |
$97.91 | $109.40 |
Bull, Base, and Bear Scenarios for Crude Oil Price Prediction
Scenario | Setup | Level |
Bull | WTI holds $102.70 and the trendline, then a 4-hour candle closes above $105.00 with futures volume over the 20-period average. | $107.45 first, then $109.40 |
Base | WTI keeps moving above the trendline with no 4-hour close beyond $102.70 or $105.00. | Between $102.70 and $105.00 |
Bear | Sellers defend $105.00, and a 4-hour candle closes under $100.46 and the trendline while volume runs above the 20-period average. | $97.91 |
Methodology
This crude oil price prediction outlook draws on three inputs. The price quote comes from the TVC feed on TradingView for the WTI CFD and was taken at 15:36 on October 30, 2026 (UTC+5:30).
The chart is a 4-hour USOIL view from the same feed. The news item comes from one social media post.
Support and resistance levels were read directly from the chart. The trendline carries no label, so the $100.4 reading is approximate.
The quote and the chart were captured seconds apart, which explains the small gap between $104.04 and $103.99.
The strike and the Rosneft statement were not independently confirmed. Futures volume, inventory data, and Brent prices were not part of this review, and the scenarios carry no assigned probabilities.
Expert Opinion
As general market commentary, refinery damage mainly affects fuel supply. Its effect on crude prices depends on whether the lost processing is offset by higher crude exports.
The post gave no estimate of the capacity affected or the length of any outage. In the short term, the $105.00 level and the volume on any move toward it will show how the market reads the news.
Disclaimer: This article is for information only and is not financial advice. Oil is volatile, and price can fall below $97.91 if the trendline fails and broader market conditions weaken. Leveraged products such as CFDs can magnify losses. No scenario here carries a stated probability, and a confirmed breakout can still reverse. Readers should do their own research and size any position to a loss they can accept.