Official Trump Price Prediction: Could $TRUMP Reclaim $3 Today?


This Official Trump Price Prediction looks at where TRUMP stands today after a week of sharp, headline-driven price swings.
Official Trump launched in early 2025 as a token tied to political branding, and it has remained one of the more closely watched names in the market ever since.
The official Trump price today is $2.26 at the moment, up 0.4% over the last 24 hours, moving inside a $2.23 to $2.33 range through the session, with a market cap of $619.045M.
Live Market Data
Metric | Value |
Price | $2.26 |
Market Cap | $619.045M |
Fully Diluted Valuation | $2.266B |
24-Hour Trading Volume | $186.559M |
Circulating Supply | 273.137M |
Total Supply | 1B |
Max Supply | 1B |
Source: Official Trump market data taken from CoinGecko, as of Sep 8, 2026. Figures may vary slightly across other tracking websites.
Liquidation Snapshot
Timeframe | Total Liquidated | Longs | Shorts |
1h | $21.31K | $21.03K | $284.41 |
4h | $81.33K | $79.03K | $2.30K |
12h | $157.27K | $114.81K | $42.46K |
24h | $489.41K | $317.76K | $171.64K |
Source: Liquidation Data Taken From CoinGlass, As of Sept 8, 2026
Long positions have absorbed most of the damage across every timeframe here, which lines up with a market that pushed higher into resistance before fading back down.
The 24-hour figures alone show longs taking roughly 65% of total liquidations, a sign that leveraged buyers got caught leaning the wrong way as price pulled back toward channel support.
Exchange Volume
Trading activity in TRUMP remains heavily concentrated on the two largest venues. Binance leads with $117.17M in 24-hour futures volume, followed by OKX at $96.58M. 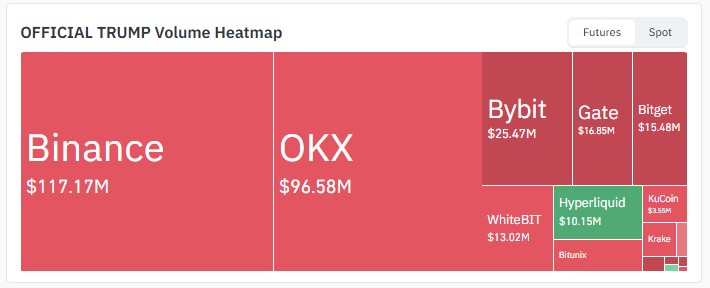
Source: Volume Heatmap Data Taken From CoinGlass, As of Sept 8, 2026
Bybit, Gate, and Bitget round out the next tier at $25.47M, $16.85M, and $15.48M, respectively, while WhiteBIT and Hyperliquid contribute $13.02M and $10.15M.
Smaller volumes are also flowing through KuCoin, Kraken, and Bitunix, rounding out a fairly wide spread across derivatives platforms.
Official Trump News: On-Chain Activity Around TRUMP
Biggest Trading Week Since Launch
One account tracking on-chain trading flow flagged this as the busiest week for TRUMP-linked terminals since the token's original launch week, with roughly $6.35 billion moved through on-chain trading terminals over the period. 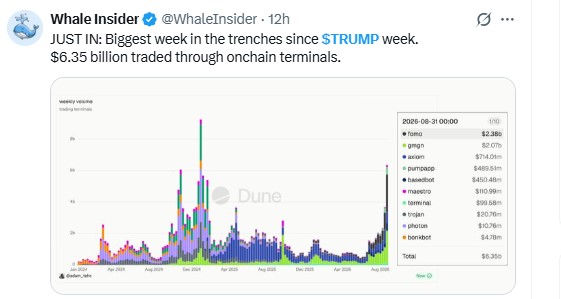
Source: Data Taken From @WhaleInsider, X Account, As of Sept 8, 2026
That volume was spread across a wide mix of platforms rather than concentrated on one, pointing to broad retail participation rather than a single large actor driving activity.
It's a notable pickup in interest, even as the price itself has stayed range-bound.
Official $Trump Price Prediction: Technical Outlook
On the 4-hour TRUMP/USDT chart on Binance, price has been climbing inside an ascending channel since late August, with a fairly consistent series of higher highs and higher lows.
Right now, $TRUMP sits close to the lower boundary of that channel, testing whether buyers step back in at this zone. 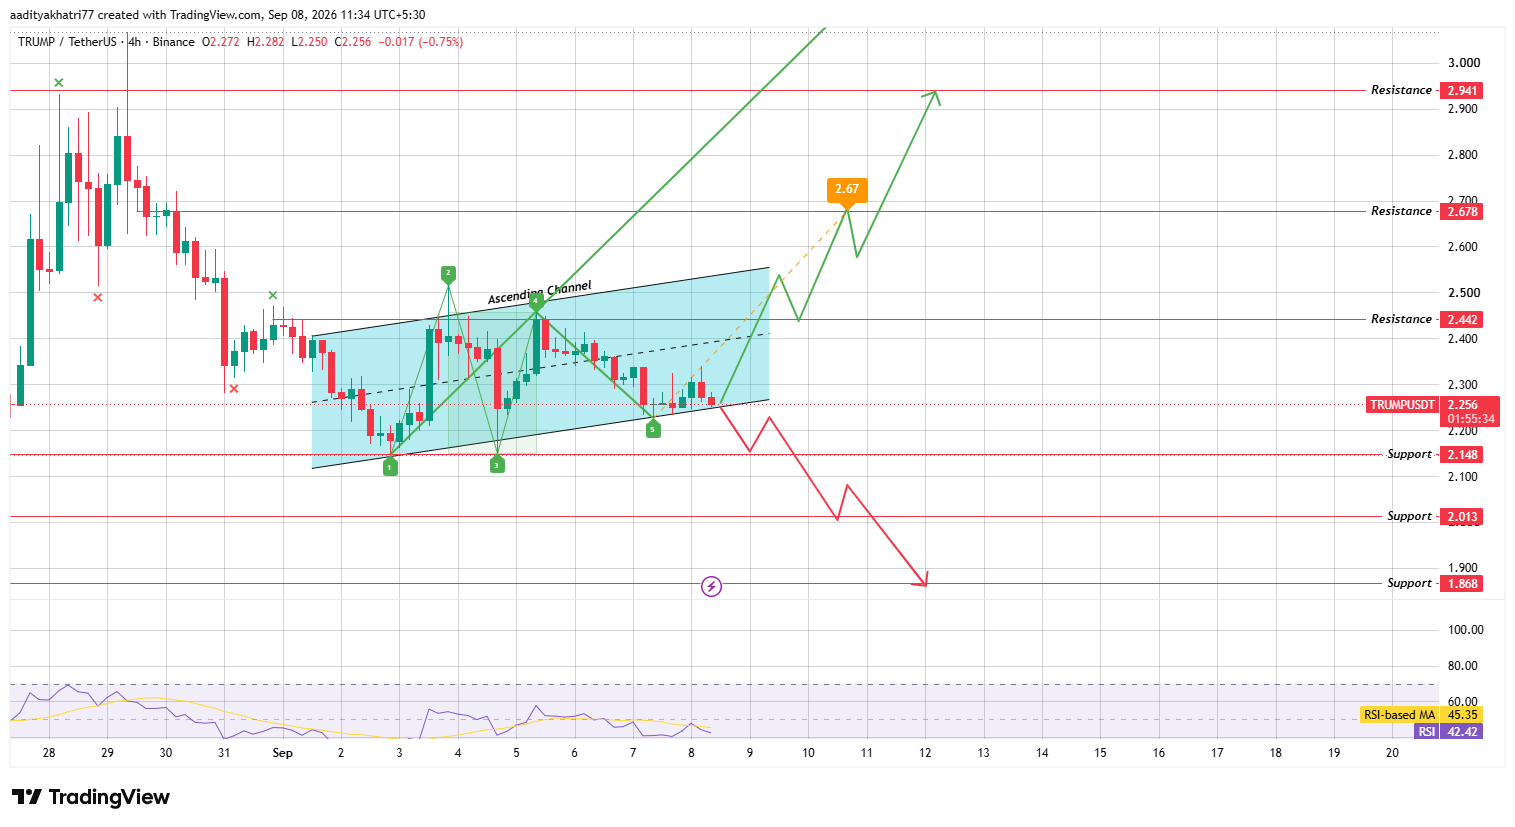
Source: Chart Taken From TradingView, as of Sep 8, 2026
RSI has cooled to 42.74, sitting just below its moving average of 45.37, reflecting the recent pullback rather than outright bearish pressure.
A Wolfe wave structure on the chart also projects an upside target near $2.67, suggesting the setup still leans constructive if the channel holds.
Could $TRUMP Break Toward Higher Resistance?
If $TRUMP holds the lower channel boundary and volume returns on a 4-hour candle close back above the channel's midline, the path toward $2.442 opens first.
Clearing that on strong volume brings the Wolfe wave target of $2.67 into range, with $2.941 as the next resistance if buying pressure extends further.
What Happens If $TRUMP Breaks the Lower Boundary?
If sellers instead push the price through the channel's lower boundary with volume confirming the move, $2.148 becomes the first support in view.
A failure to hold that level opens the door toward $2.013, and continued selling beyond that could pull the price down to $1.868, which would mark a clear breakdown from the multi-week uptrend structure.
Support and Resistance Levels
Support | Resistance |
$2.148 | $2.442 |
$2.013 | $2.678 |
$1.868 | $2.941 |
Bull, Base, and Bear Scenarios
Scenario | Setup | Level |
Bull | Channel support holds, breakout above midline on volume | $2.442–$2.941 |
Base | Price stays range-bound near channel support. | $2.15–$2.35 |
Bear | Break below the channel's lower boundary. | $2.148–$1.868 |
Glossary
Two parallel lines sloping upward, with price bouncing between them as the trend climbs, that's basically what an ascending channel looks like on a chart.
The Wolfe Wave is a bit more involved: it's built from five connected swing points, and once that structure completes, it tends to project where price could head next.
RSI works differently altogether, tracking how fast and how far price has moved recently, which is why traders lean on it to spot momentum fading or building before price itself confirms the shift.
Then there's liquidation, which kicks in when an exchange force-closes a leveraged position because the trader's margin has run out, and it tends to spike hardest whenever price whips sharply against a crowd of over-leveraged bets.
Support and resistance are simpler than all of that: just the price zones where buyers or sellers have shown up strongly enough, more than once, to stall or reverse a move.
TRUMP vs Bitcoin
Like most tokens outside the largest few by market cap, TRUMP's price swings tend to track the broader crypto market's mood, which is still shaped heavily by Bitcoin price today and where Bitcoin price prediction sentiment currently sits.
When bitcoin has traded with more volatility recently, $TRUMP has shown sharper reactions on both sides of its channel, reflecting how closely smaller-cap tokens lean on overall market risk appetite rather than moving purely on their own news flow.
Methodology
This Official Trump Price Prediction is built on 4-hour candlestick data from Binance, RSI readings, and the ascending channel and Wolfe wave structures visible on the chart since late August 2026.
The scenario levels above are tied to specific breakout or breakdown conditions and are not guaranteed outcomes.
Anyone following official Trump news or Trump news today should treat these levels as a technical framework rather than a fixed prediction.
Expert Opinion
Market commentators following the official Trump price prediction outlook note that the current pullback to channel support looks more like a routine retest than a trend reversal, given that RSI has cooled without breaking down sharply.
Their view is that this week's surge in on-chain trading volume suggests underlying interest remains strong, even if price itself needs a volume-backed breakout to confirm the next leg higher.
Disclaimer: This official Trump price prediction is for informational purposes only and should not be treated as financial advice. Cryptocurrency markets are highly volatile, technical patterns can fail to play out as expected, and any of the scenarios described above carry a realistic probability of not occurring. Readers should conduct independent research before making any investment decisions.
Also read:

















